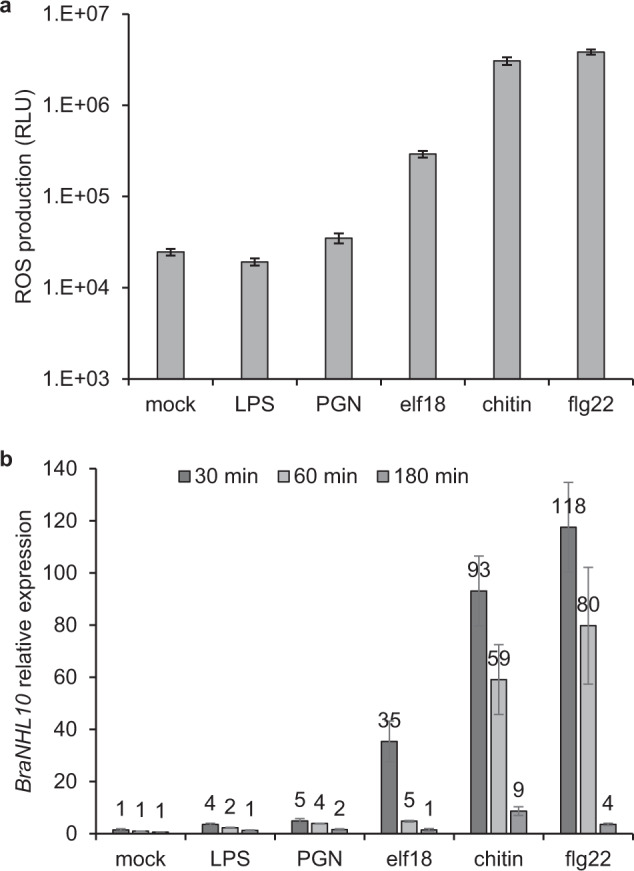
Fig. 2. Different MAMPs elicit ROS burst and modulate gene expression in B. rapa.

Norang leaf discs were treated with water (mock), 50 μg ml−1 LPS, 50 μg ml−1 PGN, 100 nM elf18, 100 μg ml−1 chitin or 100nM flg22. a Total ROS production during 75 min measurement. Data are mean values +/− standard error of relative light unit (RLU) from three independent biological repeats (n = 48). Note logarithmic scale. b BraNHL10 (Bra017272) expression normalized by BraEF1α (Bra006661) and relative to 60 min mock-treated sample. Data are mean values +/− standard error from three independent biological repeats
