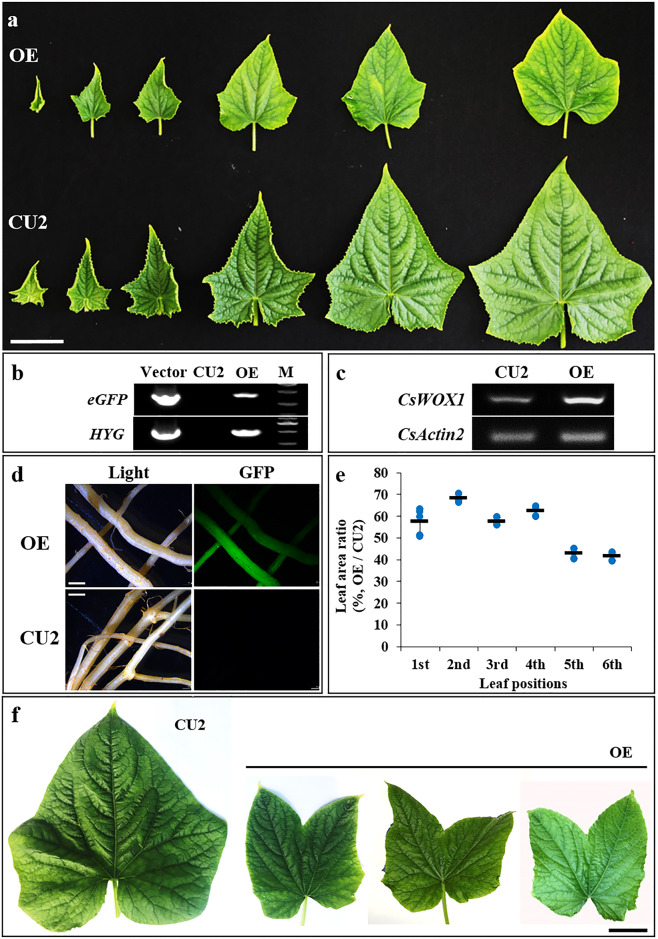
Fig. 4. Overexpression of CsWOX1 (OE) in cucumber.
a Leaf shape in OE and wild-type CU2. Six successive leaves (from the left) were harvested from the top of the same plant. b PCR assay of the OE and CU2 lines. PCR targeted the CDS of the eGFP and HYP genes in the plasmid. M: DNA marker. c Semiquantitative PCR assay of the OE and CU2 leaves. d Fluorescence detection of the OE and CU2 roots. e The area ratio of leaves from OE to those from CU2 using six successive top leaves from the same plant representing different growth stages. Each point represents a value in the set of data, and the short black line represents the mean of this set of data. Five biological repeats were included per measurement. f Abnormal leaves (‘butterfly-shaped’) with seven primary veins extending from the petiole in the OE plant. Bar = 5 cm (a), 2 mm (d), and 3 cm (f)

