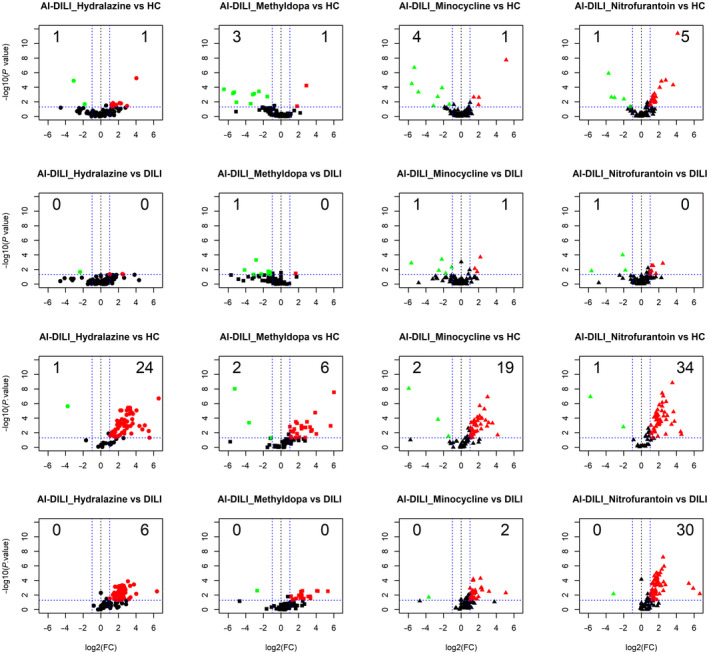
Fig. 5.

Volcano plots of IgG autoantibodies between medication‐specific AI‐DILI versus HCs (first row), medication‐specific AI‐DILI versus DILI controls (second row), IgM autoantibodies between medication‐specific AI‐DILI versus HCs (third row), IgM autoantibodies medication‐specific AI‐DILI versus DILI controls (fourth row), displaying each autoantibody as a single point with −log10 (P value) on the y axis versus log2 [FC] on the x axis. Red points indicate a statistically significant increase in mean autoantibody levels for each group comparison; green points indicate a statistically significant decrease for each group comparison. Abbreviation: FC, fold change.
