
Figure 3.
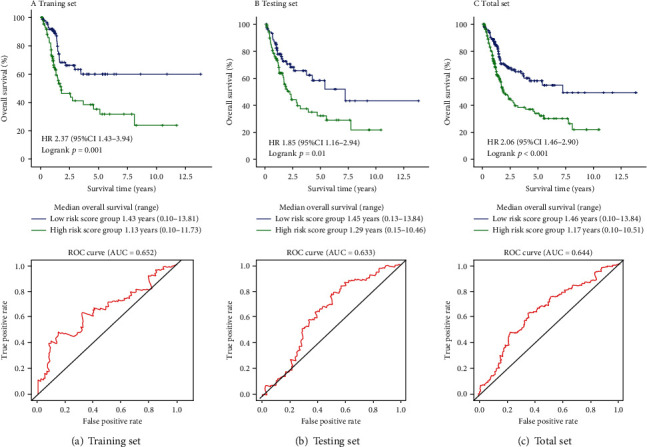
Kaplan-Meier plots and ROC curve for 3-year survival prediction of the training set, testing set, and total set. (a) The training set. (b) The testing set. (c) The total set.
Official websites use .gov
A
.gov website belongs to an official
government organization in the United States.
Secure .gov websites use HTTPS
A lock (
) or https:// means you've safely
connected to the .gov website. Share sensitive
information only on official, secure websites.
Kaplan-Meier plots and ROC curve for 3-year survival prediction of the training set, testing set, and total set. (a) The training set. (b) The testing set. (c) The total set.