
Figure 2.
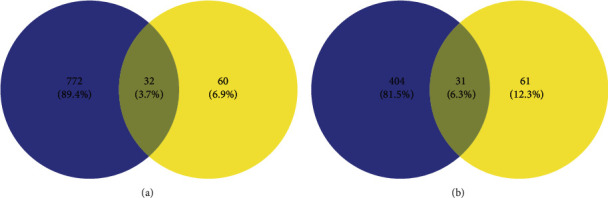
(a) Intersection targets of plantain and gout. (b) Intersection targets of plantain and hyperuricemia. Note: blue represents the number of targets for gout or hyperuricemia, yellow represents the number of targets for active constituents of plantain, and the middle part represents the intersection targets of the two.