
Figure 5.
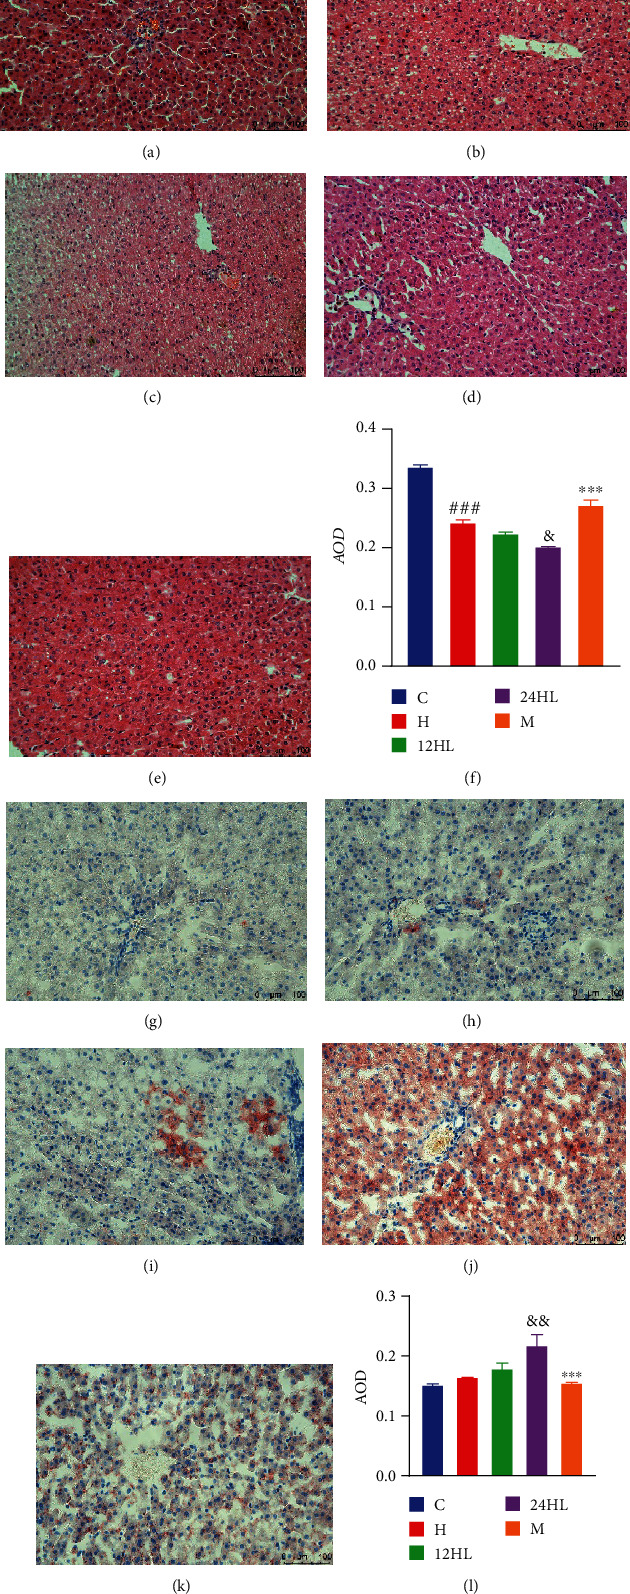
Effects of melatonin on histopathological changes in hepatic tissue. H&E staining (200x): (a) C group, (b) H group, (c) 12HL group, (d) 24HL group, and (e) M group after treatment (on week 10); (f) AOD of H&E staining. Oil Red O staining (200x): (g) C group, (h) H group, (i) 12 HL group, (j) 24HL group, and (k) M group after treatment (on week 10); (l) AOD of Oil Red O staining. Integrated optical density (IOD)/area of staining in each immunohistochemistry staining image. AOD: average optical density; C: control group; H: HFD group; 12HL: 12 h light group; 24HL: 24 h light group; M: melatonin group. The values are expressed as the means ± S.D. (n = 3 per group). ###P < 0.001, HFD vs. control; &P < 0.05 and &&P < 0.01, 24HL vs. 12HL group; ∗∗∗P < 0.001, M vs. 24HL group.