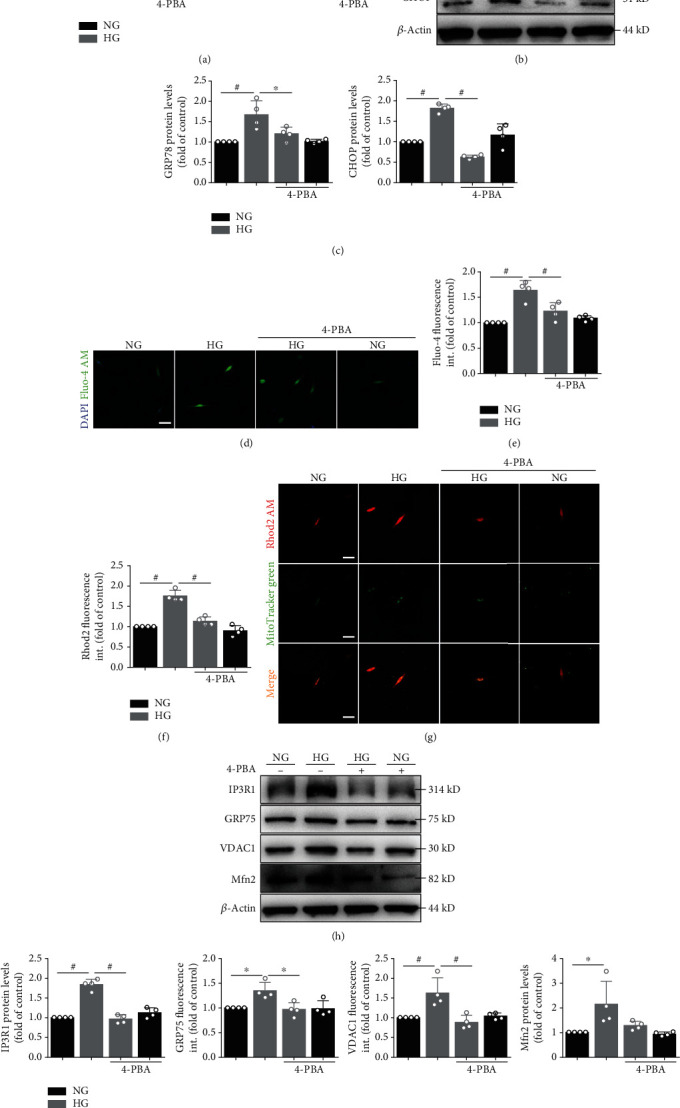
Figure 1.

High glucose induces ER stress and upregulates intracellular and mitochondrial Ca2+ levels. (a) Primary atrial myocytes under normal glucose (NG) or high glucose (HG) with or without 4-PBA for 24 hours. Quantification of GRP78 and CHOP mRNA expression. (b) Primary atrial myocytes under NG or HG with or without 4-PBA for 48 hours. GRP78 and CHOP protein level in atrial myocytes detected by Western blot analysis. (c) Quantification of GRP78 and CHOP protein level in (b). (d) Representative confocal microscopy images of fluorescence staining for Fluo-4 AM and DAPI. Scale bar, 20 μm. (e) Quantification of Fluo-4 AM fluorescence intensity in (d). (f) Representative confocal microscopy images of fluorescence staining for Rhod2 AM and MitoTracker Green. Scale bar, 20 μm. (g) Quantification of Rhod2 AM fluorescence intensity in (f). (h) MAM proteins such as IP3R1, GRP75, VDAC1, and Mfn2 protein level in atrial myocytes detected by Western blot analysis. (i) Quantification of IP3R1, GRP75, VDAC1, and Mfn2 protein level in (h). Data are mean ± SEM, n = 4 independent experiments, ∗p < 0.05, #p < 0.01, ANOVA with Bonferroni posttest.
