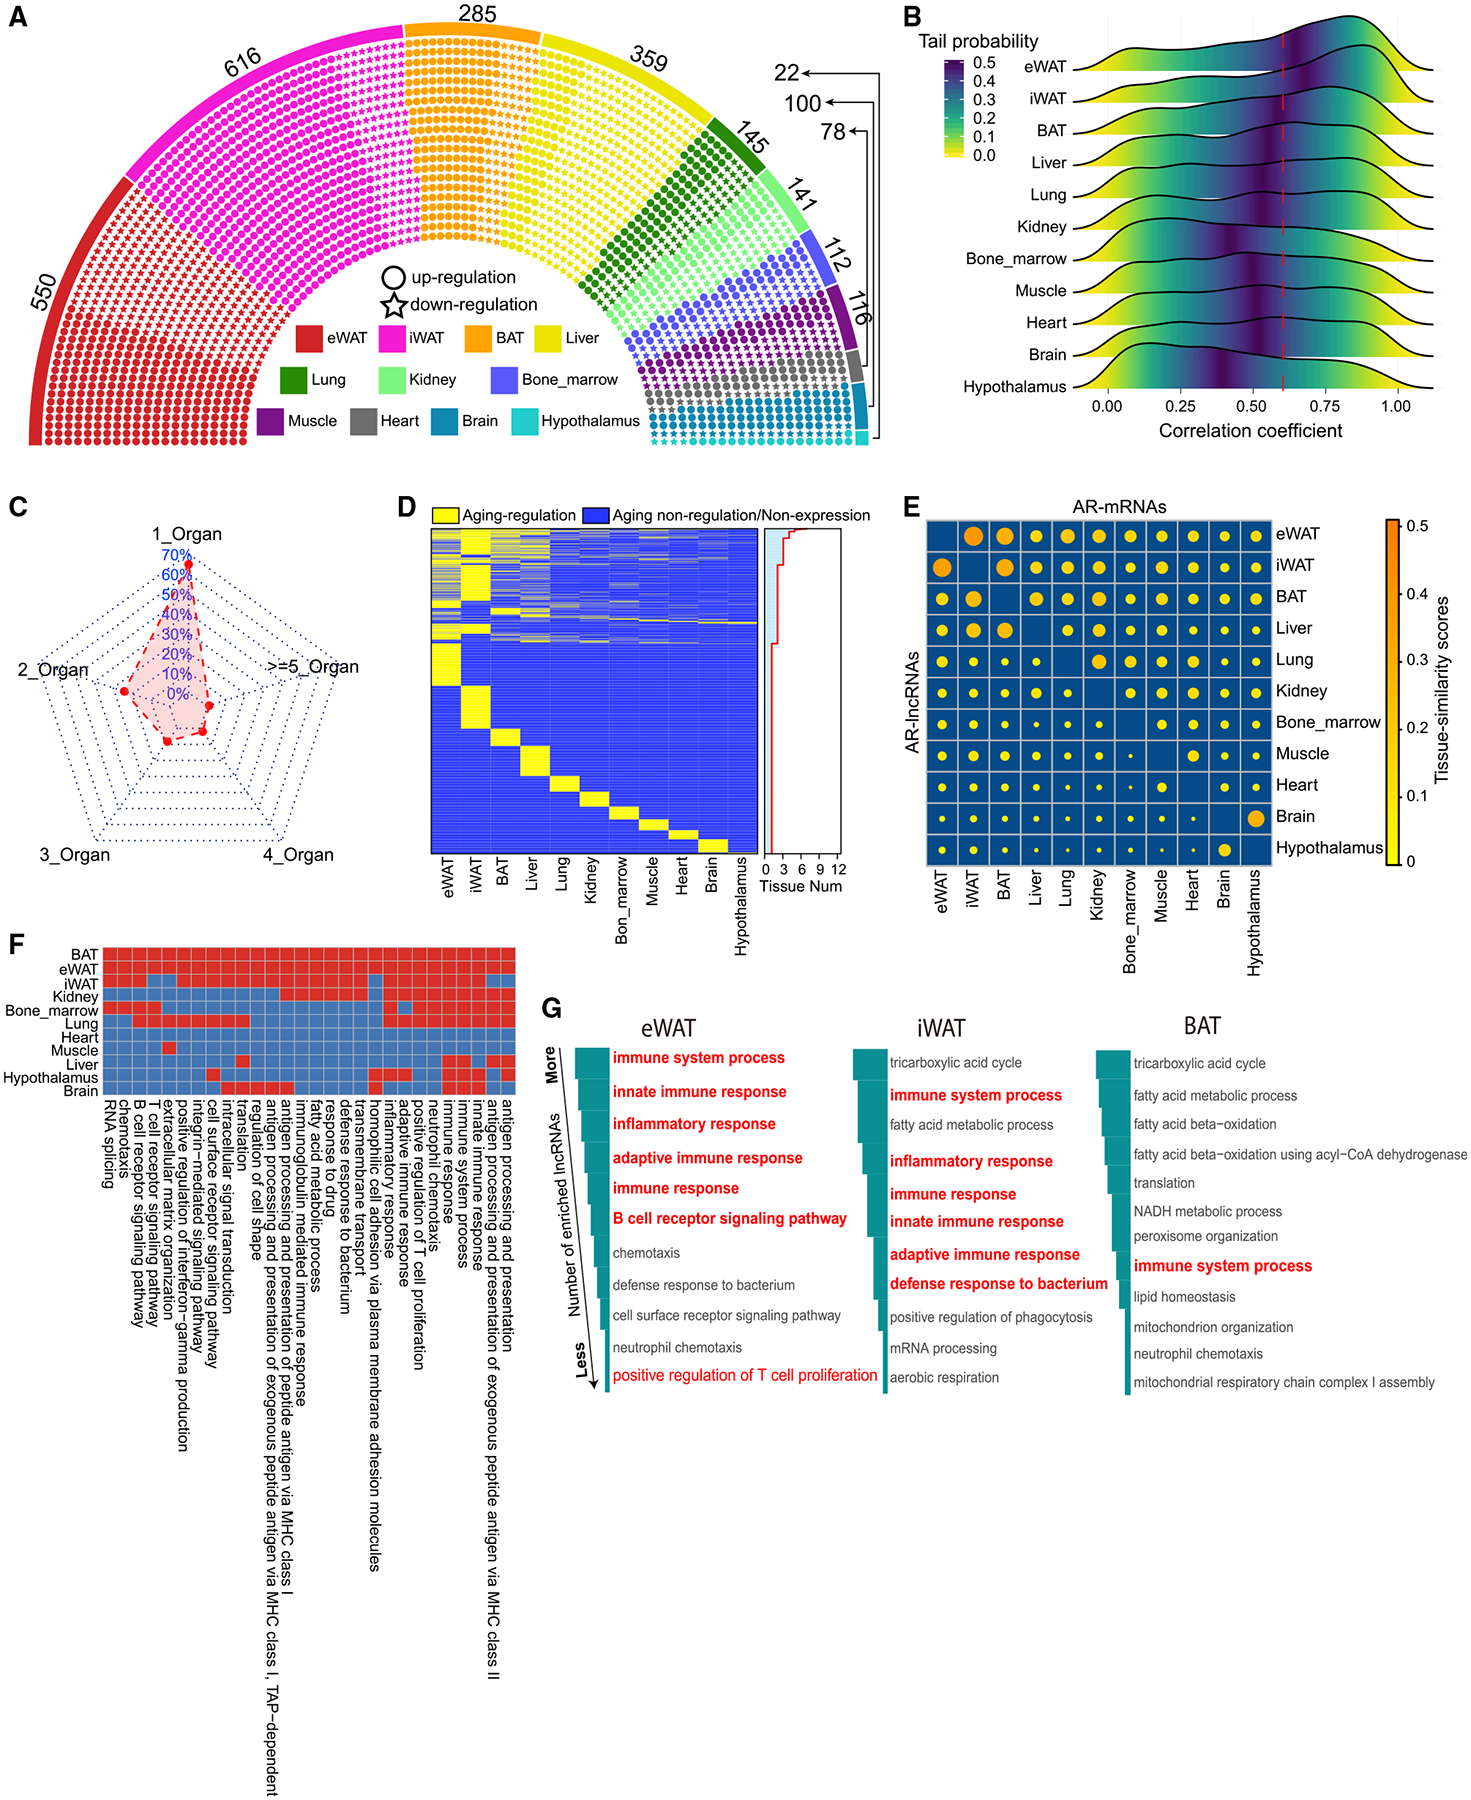
Figure 2. Identification and Functional Annotation of Aging-Regulated lncRNAs.

(A) The distribution of aging-regulated lncRNAs (AR-lncRNAs) in all examined organs. Each dot represents an AR-lncRNA.
(B) The distribution of correlation coefficient between lncRNA expression and age in each tissue.
(C) Percentage of AR-lncRNAs uniquely discovered in a single organ and commonly discovered in multiple organs.
(D) The presence of AR-lncRNAs across all examined tissues. Distribution in right panel represents the number of tissues in which a given AR-lncRNA can be identified.
(E) The tissue-similarity scores of AR-lncRNAs and AR-mRNAs between different tissues in a pairwise manner. Top right triangle: the tissue-similarity scores of AR-mRNAs. Bottom left triangle: the tissue-similarity scores of AR-lncRNAs. Tissue-similarity scores represent the tissue similarity between two organs based on the overlapped extent of their gene sets (detail in STAR Methods).
(F) BPs that are associated with lncRNAs through lncRNA~mRNA co-expression analysis in more than three tissues.
(G) The top BPs ranked by the number of AR-lncRNAs that are associated with each BP in adipose tissues.
