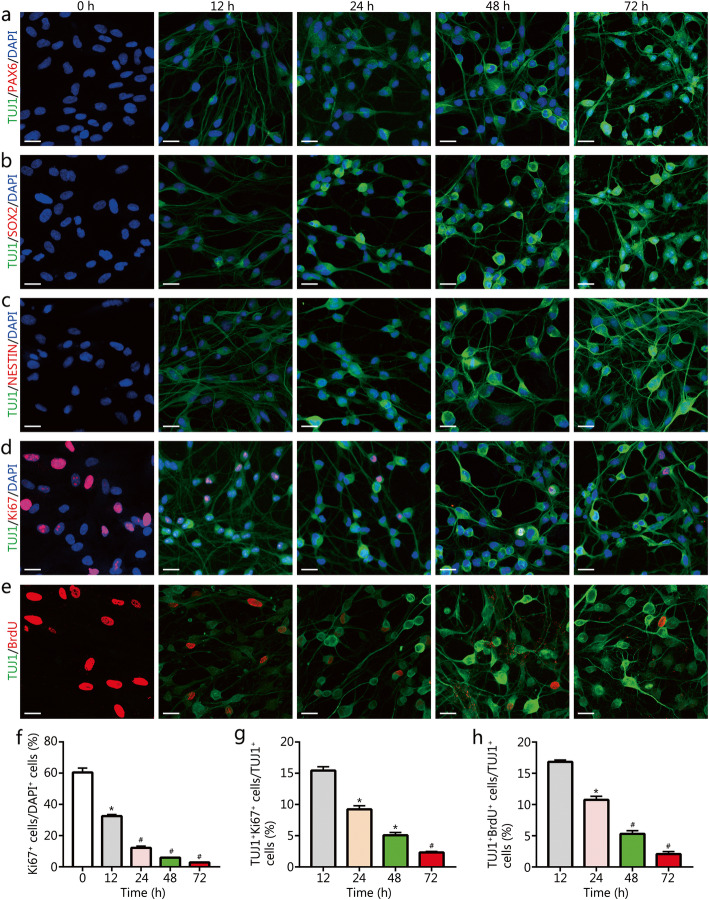
Fig. 5.
The expression of NPC/NSC and proliferative markers in the ihDAs. a-c Immunostaining analysis of expression of NPC/NSC markers PAX6, SOX2, and NESTIN in IMR-90 fibroblasts after 0–72 h of chemical induction. Scale bars = 25 μm. d and e Immunostaining analysis of proliferation markers Ki67 and BrdU after 0–72 h of chemical induction. Sale bars = 25 μm. f Quantification of the percentage of Ki67+ cells relative to the total DAPI+ cells (mean ± SEM from 10 randomly selected 20× visual fields from triplicate samples), *P < 0.001, #P < 0.0005, versus control (0 h). g Quantification of the percentage of TUJ1+Ki67+ cells relative to TUJ1+ cells at 12, 24, 48, and 72 h after chemical induction (mean ± SEM from 10 randomly selected 20× fields from triplicate samples), *P < 0.001, #P < 0.0005, versus 12 h. h Quantification of the percentage of TUJ1+BrdU+ cells relative to TUJ1+ cells at 12, 24, 48, and 72 h after chemical induction (mean ± SEM from 10 randomly selected 20× visual fields from triplicate samples), *P < 0.001, #P < 0.0005, versus 12 h

