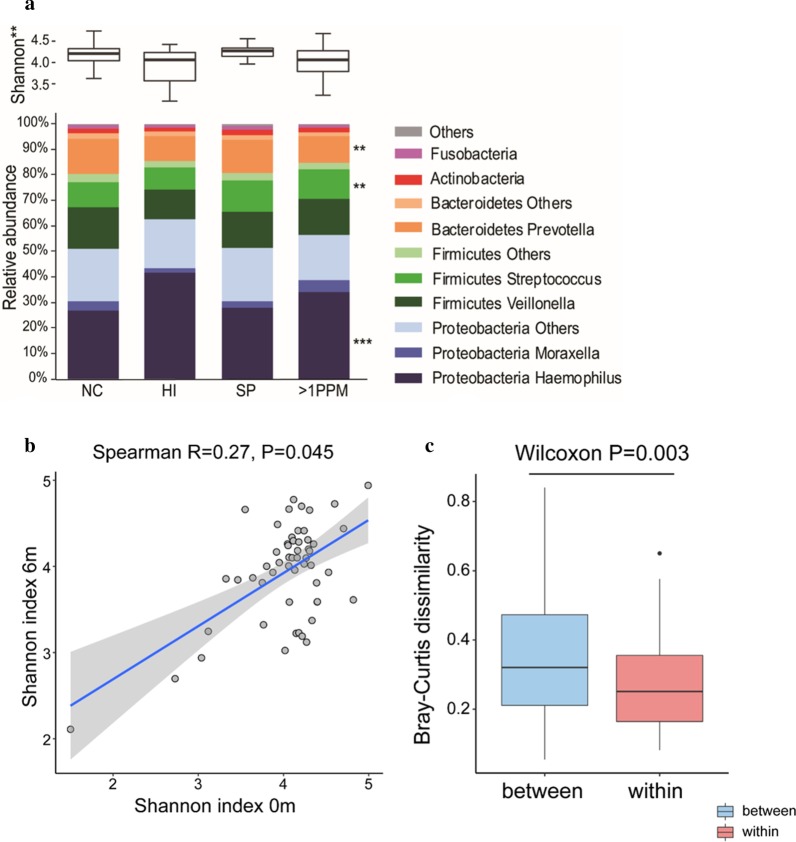
Fig. 2.
Sputum microbiome profiles in COPD patients at baseline. A proportion of patients provided sufficient sample for 16S rRNA sequence analysis. Shannon Diversity and relative abundance of major bacterial taxa and genera for PPM groups defined by genome copies per mL of ≥ 1 × 10⁴; no colonisation (NC), Haemophilus influenzae (HI), Streptococcus pneumonia (SP) and > 1PPM n = 153 (a), Correlation analysis for shannon diversity of paired samples at baseline and 6 months (n = 54) (b), Composition dissimilarity analysis between paired samples at baseline and 6 months, and samples from different individuals (n = 54) (c). *, **, ***Significant difference to no colonisation group (FDR p < 0.05, < 0.01 and < 0.001 respectively)

