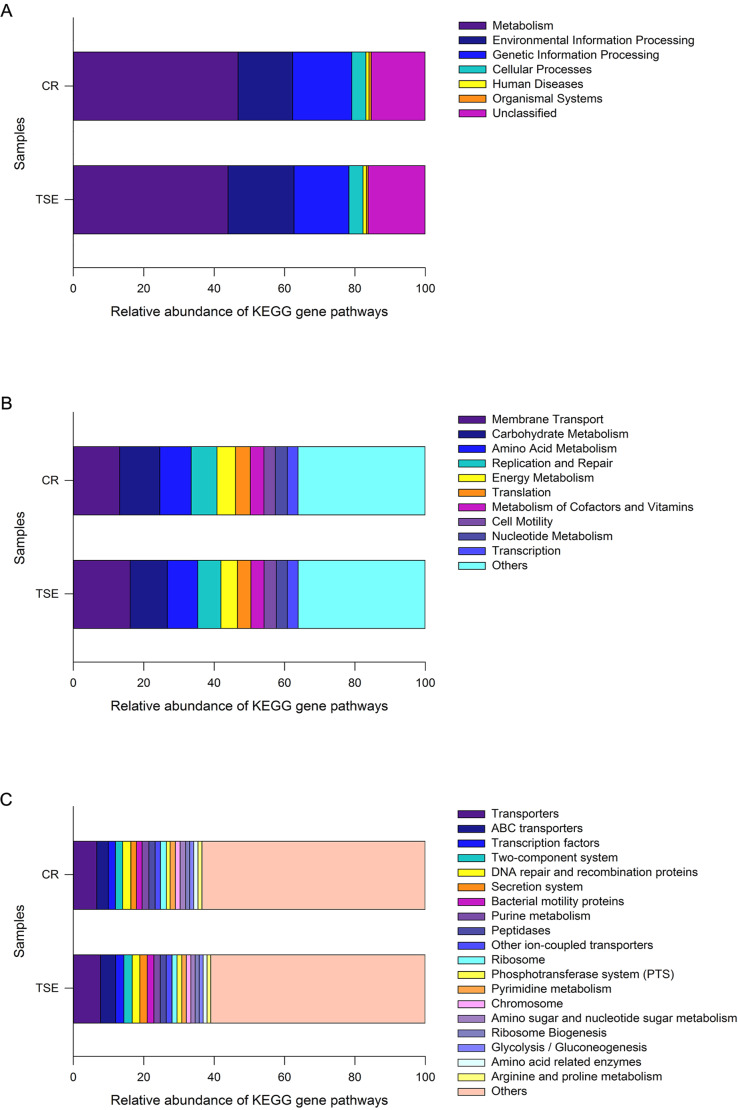
Figure 4. Gene functional categories based on 16S RNA in the gut microbiota at top (A), second (B) and third (C) levels of relative abundance.
One color indicates one gene function. Detailed descriptions are shown on the right side of each plot. The colors for others in B and C indicate all other gene functions not listed in these two plots. See Fig. 1 for species abbreviations.

