Figure 3.
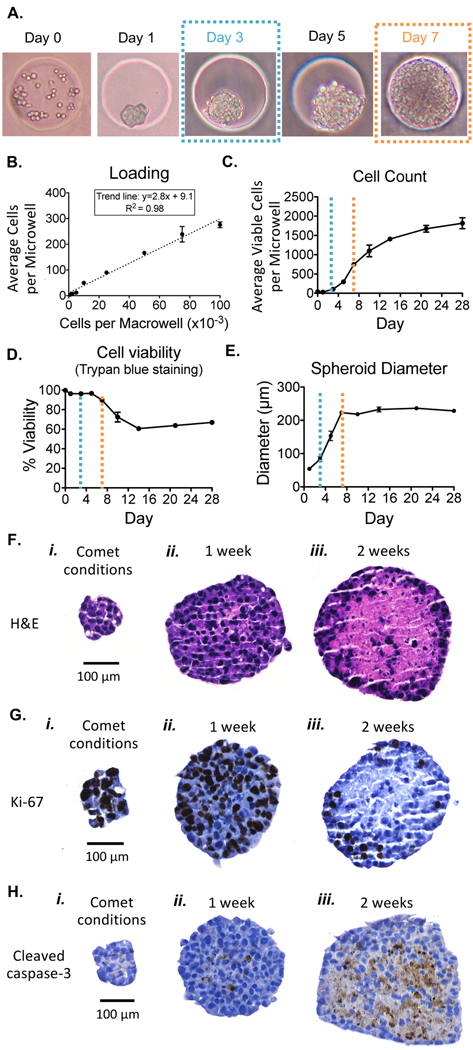
After loading, HepG2 cells aggregate within microwells, and spheroids continue to grow and remain viable. (A) HepG2 cells in spheroids divide in the agarose microwells after loading. (B) Average cells loaded per 250 μm diameter microwell for various macrowell loading densities. Note, pictured in Day 0 of A is the initial microwell loading when a macrowell density of 10 000 cells per macrowell is used. (C) Average number of viable cells per microwell. The dashed lines correspond to days post loading pictured in A, where blue represents cells at 3 days, and orange represents cells at 7 days. (D) Cell viability measurements obtained with Trypan blue staining. (E) Spheroid diameter over culture time in the agarose chip. (F) H&E staining of spheroids. (G) Ki-67 staining of spheroids. (H) Cleaved caspase-3 staining of spheroids.

