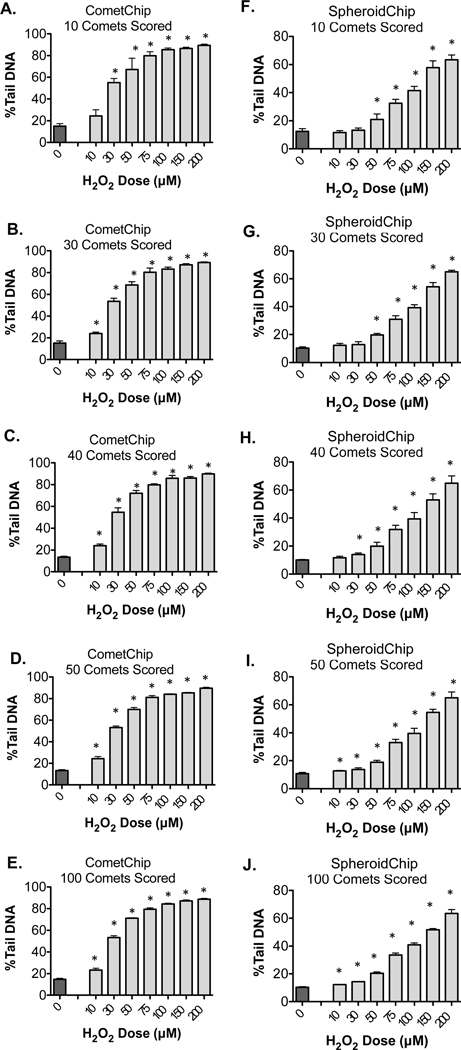
Figure 7.
Analysis of the impact of comet pool size. H2O2 treated cells and nontreated controls from Figure 6 were compared with a paired, two-tailed, Student’s t-test, *P < 0.05. For each pool size, means and standard deviation of three randomly selected groups are shown for CometChip (A–E) or SpheroidChip (F–J).

