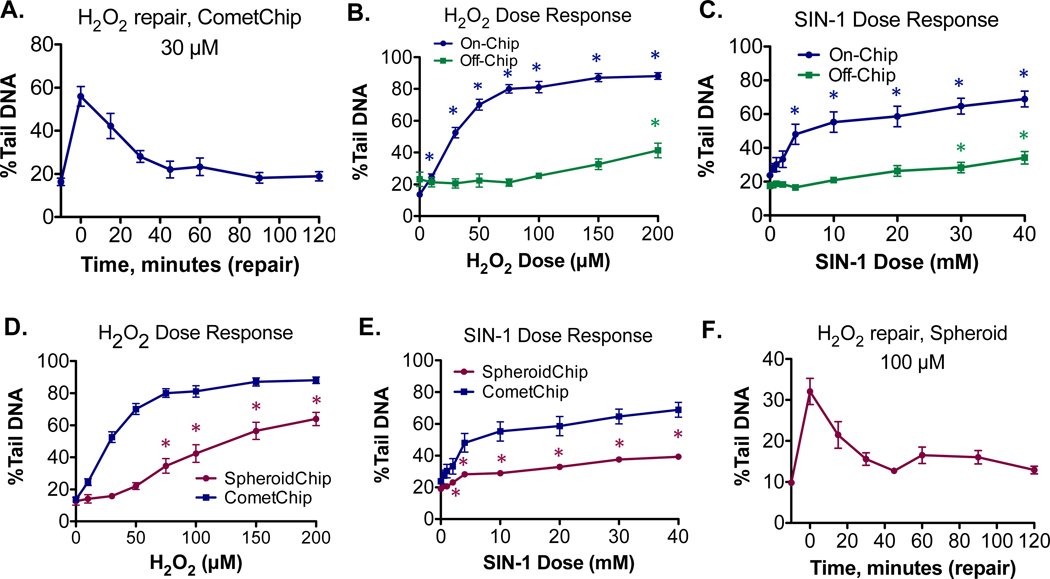
Figure 8.
Performing chemical exposure directly on cells encapsulated in agarose chips allows for analysis of rapidly repaired DNA damage. H2O2 or SIN-1 treated cells and nontreated controls were compared. (A) CometChip repair kinetics of HepG2 cells treated with 30 μM of H2O2. Treatment and repair is performed on-chip. (B) Comparison of on-chip versus off-chip CometChip dose response in H2O2 treated cells. For on- chip experiments, statistically significant increases in DNA damage were observed at all doses. The average of the experiments shown in Figure 5E is plotted. For off-chip experiments, there is a ∼40 min lag time prior to comet analysis and statistical significance was observed at a dose of 200 μM. (C) Comparison of on-chip versus off-chip CometChip dose response in SIN-1 treated cells. For on-chip experiments, statistically significant increases in DNA damage were observed at 4 mM and above. For off-chip experiments, there is a ∼40 min lag time prior to comet analysis and statistical significance was observed at 30 mM and above. (D) Dose response for H2O2 treated spheroids, consisting of the average of the experiments shown in Figure 5F. A statistically significant increase in DNA damage was observed at 75 μM and above. On-chip CometChip results from B are replotted on same graph for comparison. (E) Dose response for SIN-1 treated spheroids. A statistically significant increase in DNA damage was observed at 2 mM and above. On-chip CometChip results from C are replotted on same graph for comparison. (F) SpheroidChip repair kinetics of HepG2 spheroids treated with 100 μM of H2O2. Treatment and repair is performed on-chip. Statistical analysis was performed with a one-way ANOVA with post hoc analysis using Dunnett’s multiple comparison test, *P < 0.05.

