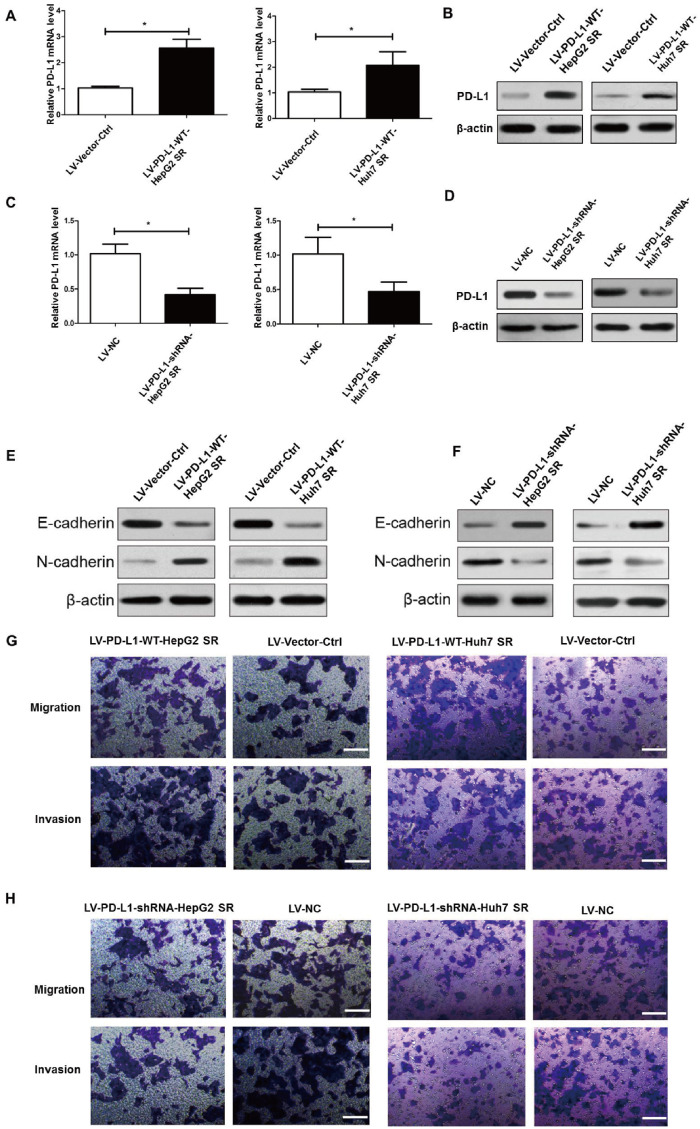
Figure 2.
PD-L1 expression promoted EMT, migration, and invasion of HepG2 SR and Huh7 SR cells. (A) and (B) Quantitative real-time PCR (qRT–PCR) analysis and Western-blot assay of PD-L1-expression levels in HepG2 SR and Huh7 SR cells following stable overexpression of PD-L1 (LV-PD-L1-WT-HepG2 SR and LV-PD-L1-WT-Huh7 SR cells). LV-Vector-Ctrl represents control vector transfection. (C) and (D) qRT–PCR analysis and Western-blot assay of PD-L1 expression levels in HepG2 SR and Huh7 SR cells following stable knock-down of PD-L1 with shRNAs (LV-PD-L1-shRNA-HepG2 SR and LV-PD-L1-shRNA-Huh7 SR cells). LV-NC represents mock lentiviral infection. (E) and (F) Western-blot assay of the epithelial marker proteins E-cadherin and N-cadherin demonstrating their expression in HepG2 SR and Huh7 SR cells following stable overexpression or stable knock-down of PD-L1. β-actin was used as an endogenous control. (G) Cell migratory and invasive abilities of PD-L1-overexpressing cells and those of the corresponding control cells were examined by the transwell assay. Scale bar, 200 μm. (H) Cell migratory and invasive activities of PD-L1 ablation cells and of the corresponding control cells were examined by transwell assays. Scale bar, 200 μm. Cell transwell assays were performed in 24-well transwell chambers containing polycarbonate filters with (invasion) or without (migration) 8-mm pores coated with matrigel. Migrated and invaded cells were stained and counted in at least three microscopic fields. *P < 0.05.

