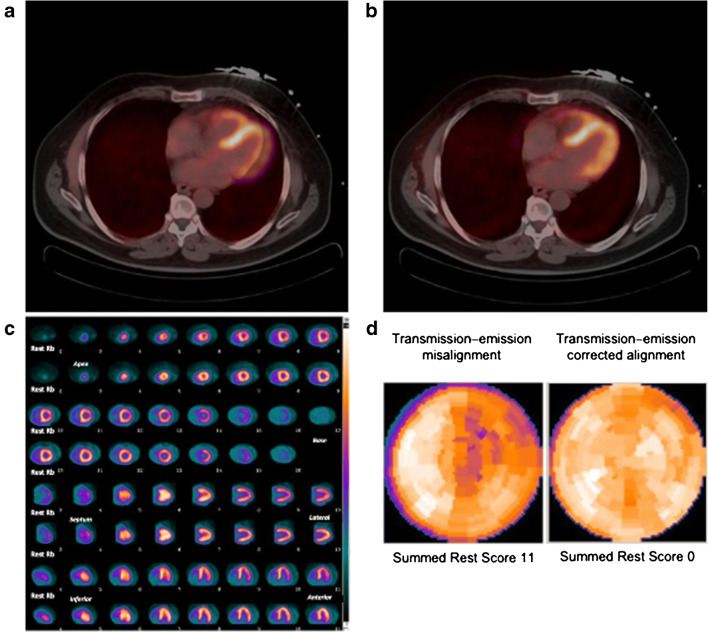
Fig. 5.
Transmission–emission misalignment example. Misalignment between CT transmission and rest 82Rb perfusion PET images (a) with correction of transmission–emission misalignment (b). Anterolateral perfusion defect on rest 82Rb perfusion images (c, upper rows) deriving from applying the incorrect attenuation coefficients during tomographic reconstruction to an area of LV myocardium overlying lung field on CT transmission scan, and normal rest perfusion study (c, lower rows) after correction, with relative polar maps (d)

