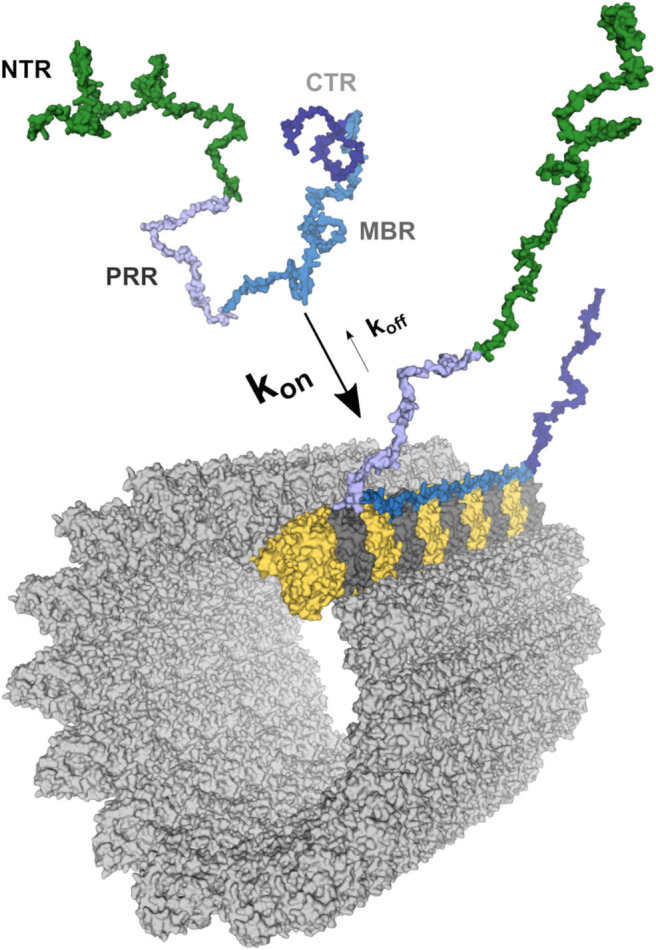
Figure 1.

Schematic representation of the tau-microtubule interaction. A free molecule of tau is represented as one of the potential conformations of tau (441 aa long CNS isoform) generated as described previously (20). The different tau regions were mapped onto the model and color-coded as follows: NTR (aa 1–171)—green; PRR (aa 172–243)—light blue; MBR (aa 244–368)—blue; CTR (aa 369–441)—dark blue. The structure of the MBR binding to microtubules is based on PDB:6CVJ and PDB:6CVN structures showing interactions of first two microtubule-binding repeats of tau, R1 and R2, respectively (21). Further repeats, R3 and R4, were based on PDB:6CVN. The rest of tau molecule was artistically rendered based on the free molecule of tau. Binding to a single protofilament of a microtubule segment is depicted. α-tubulin is shown in yellow and β-tubulin in dark gray. All 3D structures are represented as surfaces and were visualized and rendered using PyMOL (www.pymol.org).
