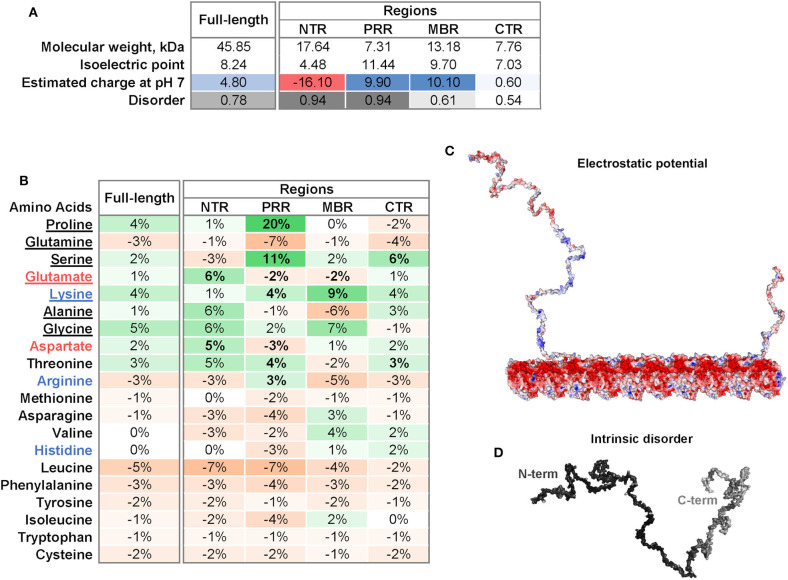
Figure 2.
Physicochemical properties of tau and individual tau regions. (A) Isoelectric point, charge and disorder of full-length tau and the NTR, PRR, MBR, and CTR. The estimated charge at pH 7 is color-coded from acidic (red) to basic (blue). The extent of disorder is indicated as gray value. (B) Differences in frequencies of amino acids in tau and its four regions compared to the frequencies of amino acids encoded by the human genome according to (22). Overrepresented values are indicated in green, underrepresented values in orange color. Amino acids are sorted from disorder-promoting to order-promoting; disorder-promoting amino acids are underlined (23). (C) Electrostatic potential of tau and a microtubule protofilament. Electrostatic surface of tau was calculated with APBS Electrostatics Plugin (24). The electrostatic potential is color coded from red (negative) to blue (positive) at physiological pH. (D) Extent of intrinsic disorder of tau. Disorder was predicted using IUPred2A long (25). The extent of disorder was mapped onto the tau surface and indicated by white to black values as low or high disorder prediction, respectively.

