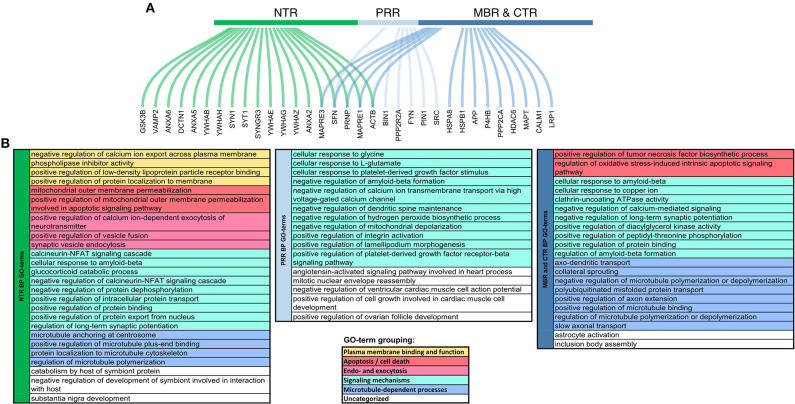
Figure 3.
Functional specialization of tau regions with respect to their molecular interactions. (A) Genes coding for interaction partners of specific tau regions. Curved lines show to which region of tau the interaction partner was mapped colored by regions, respectively. NTR (1–171), green; PRR (172–243), light blue; MBR and CTR together (244–441), blue. (B) Summary representation of GO-terms for the interaction partners, which have been mapped to the different tau regions. GO-term enrichment was performed by ClueGO plugin in Cytoscape (29, 30). Significantly enriched GO-terms (pV < 0.05) associated with Biological Processes were identified using a right-sided hypergeometric test with Bonferroni correction. GO-term fusion was used to obtain the more representative terms. GO-terms were grouped and color-coded as presented in the legend below.

