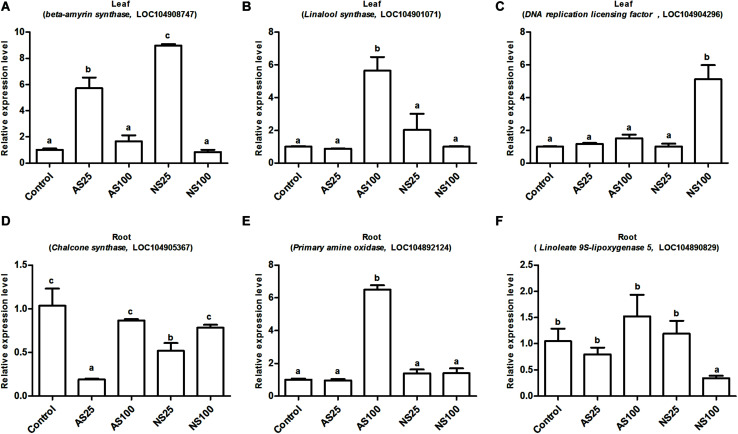
FIGURE 10.
Expression level of the selected six genes by qRT-PCR (quantitative real-time PCR) validation. (A,D) Indicate differentially expressed genes (DEGs) involved in low neutral salt or alkaline salt enhanced sugar beet growth. (B,E) Indicate DEGs involved in sugar beet alkaline salt tolerance. (C,F) Indicate DEGs involved in specific pathways of sugar beet response to high neutral salt stress. Values represent the means of three replicates. Different letters indicate significantly different at p < 0.05. Three biological replicates were performed.

