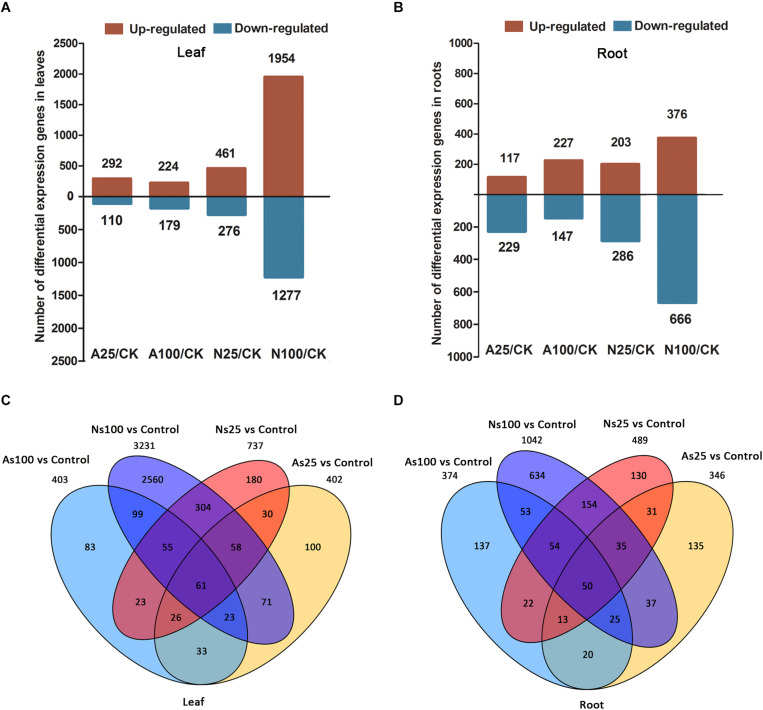
FIGURE 4.
Differentially expressed genes (DEGs) in the leaves and roots of sugar beet in response to neutral salt (NS) and alkaline salt (AS) treatment. Numbers of DEGs in leaf (A) and root (B) at different salt treatments. Venn diagrams of DEGs among different salt treatments in leaf (C) and root (D).

