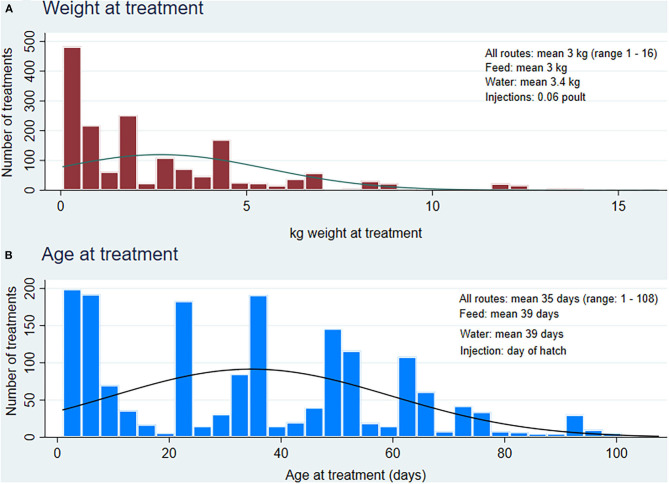
Figure 3.
Distribution of weight and age at treatment in treated turkey flocks (n = 1,721 treatments via feed, water and injection), 2013 to 2019. (A) Weight at treatment combines all the estimated weights for each treatment via injection, water and feed routes of administration, (B) Age at treatment combines all the reported age for each treatment via injection (default at day 1), water and feed routes of administration.

