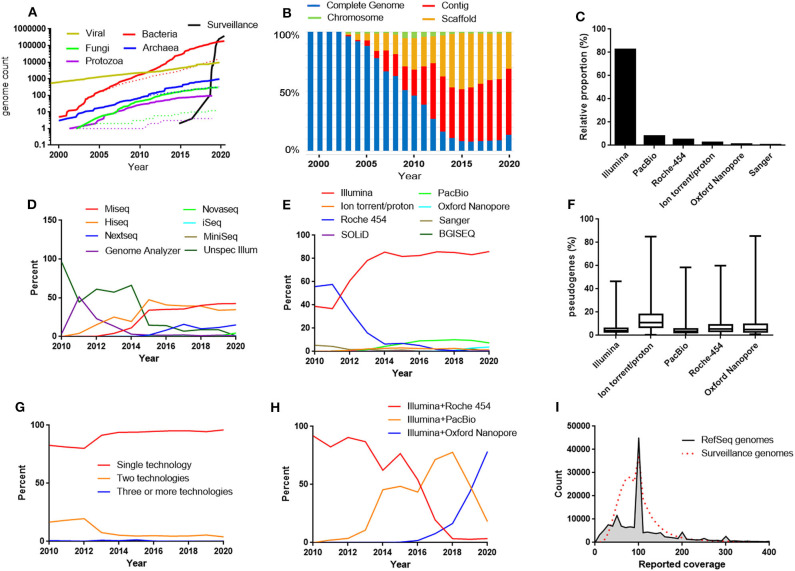
Figure 1.
(A) The growth of the RefSeq microbial genomic databases and the database of bacterial genomes excluded from RefSeq for the reason “derived from surveillance project.” Dotted lines represent number of “complete genomes.” The data for 2020 includes genomes submitted before April 17. (B) Relative proportions between the different assembly levels in the bacterial RefSeq genome database. (C) The most frequently used sequencing techniques in the bacterial RefSeq database. (D) Relative proportions between the different Illumina platforms in the bacterial RefSeq genome database. (E) Relative proportions between sequencing techniques used in bacterial RefSeq divided by years. (F) Frequencies of pseudogenes in bacterial RefSeq genomes reported to be produced by one technique alone. (G) Relative proportions between genomes produced by a single sequencing technique and combinations of techniques. (H) Relative proportions between the most frequently used combinations of sequencing techniques in the bacterial RefSeq genome database. (I) Histogram of the reported sequence depth (coverage) used in the bacterial RefSeq genome database and in the bacterial surveillance project genome database.

