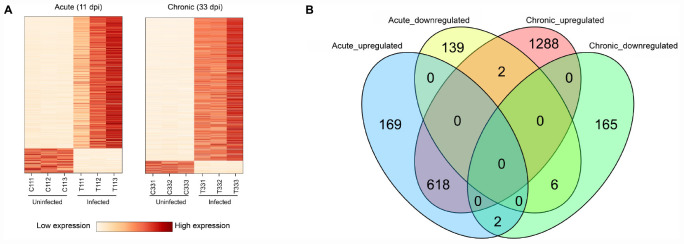
FIGURE 2.
Results of RNA sequencing (RNA-seq) and differential expression analysis of transcripts. (A) Heat maps showing the hierarchical clustering of 936 and 2,081 differentially expressed transcripts (DETs) at 11 and 33 dpi, respectively. Each mouse group included three biological replicates. (B) Venn diagram showing the overlap of DETs in the brain of acutely- and chronically-infected mice, including upregulated and downregulated transcripts.

