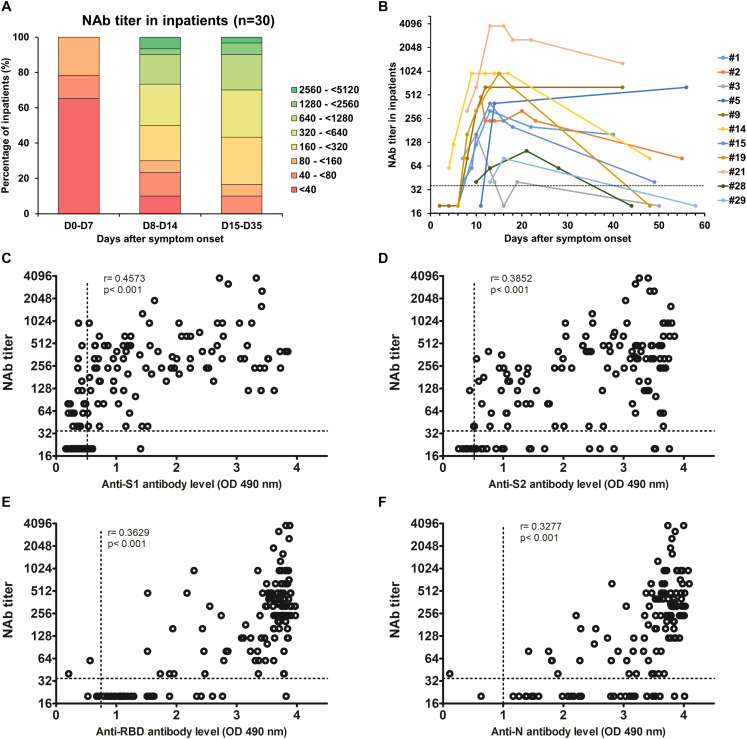
FIGURE 3.
(A) Evolution of the NAb titer in 30 COVID-19 inpatients during the first month post-symptom onset. (B) Evolution of the NAb titer in 11 COVID-19 inpatients after more than 40 days post-symptom onset. The dashed line indicates the cut-off of the assay. (C–F) Correlations between NAb titers and anti-S1 (C), anti-S2 (D), anti-RBD (E), and anti-N (F) antibody levels. Dashed lines indicate assay cut-offs for positivity. OD, optical density.

