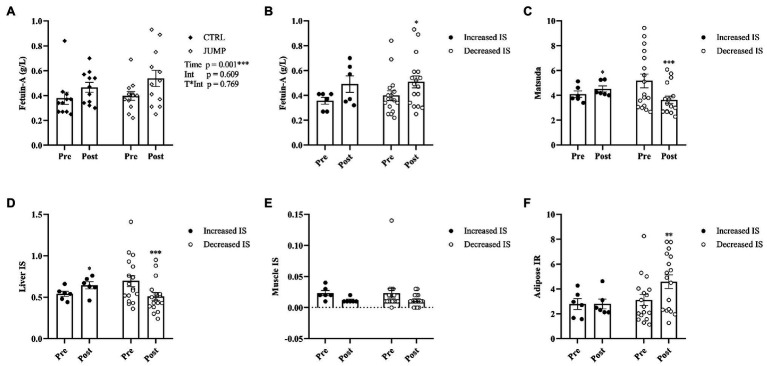
Figure 2.
(A) Circulating fetuin-A in the CTRL and JUMP groups before and after 60 days of HDT bed rest. (B–F) The effect of HDT bed rest on fetuin-A and OGTT derived indexes of insulin sensitivity and insulin resistance when subjects were divided into two subgroups based on an increase (n = 6) or decrease (n = 17) in insulin sensitivity (Matsuda) post-HDT bed rest. Data are presented as mean ± SEM. Abbreviations: CTRL, control group; JUMP, jumping countermeasure group; IS, insulin sensitivity; IR, insulin resistance; Time, main effect of time; Int, main effect of intervention; T*Int, time*intervention interaction effect. *p ≤ 0.05, **p ≤ 0.010, and ***p ≤ 0.001.

