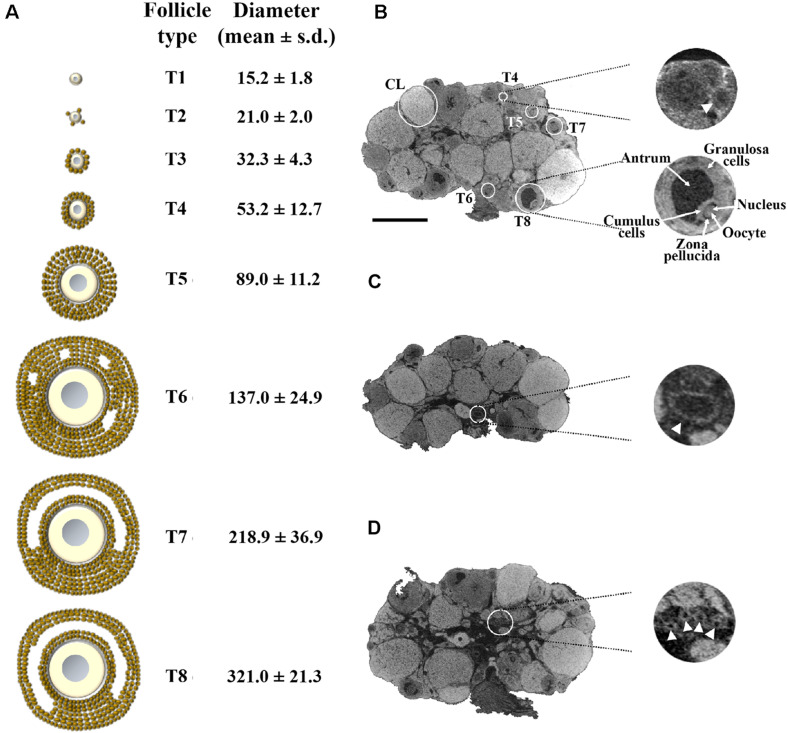
FIGURE 1.
Representative 1.5 μm/pixel microCT image of the mouse ovary. (A) Schematic representation of the eight main stages of the mouse folliculogenesis, with their corresponding size in diameter (mean ± s.d.), during the pre-antral (T1–T5) and antral (T6–T8) growth phases. (B) A representative microCT section highlighting follicles from T4 to T8 and corpora lutea (CL). On the right-hand side (top), an enlargement of a secondary T4 follicle (arrow); on the right-hand side (bottom), an enlargement of a fully grown T8 follicle, in which the different cytological components (granulosa cells, antrum, cumulus cells, zona pellucida space, oocyte with its nucleus) are clearly visible. (C) microCT section with an enlargement of a vessel (arrowhead; 150 μm in diameter) at the ovarian hilum site. (D) microCT section with an enlargement of a group of small vessels (arrowheads; 35 μm in diameter) in the medulla region. Bar, 500 μm.

