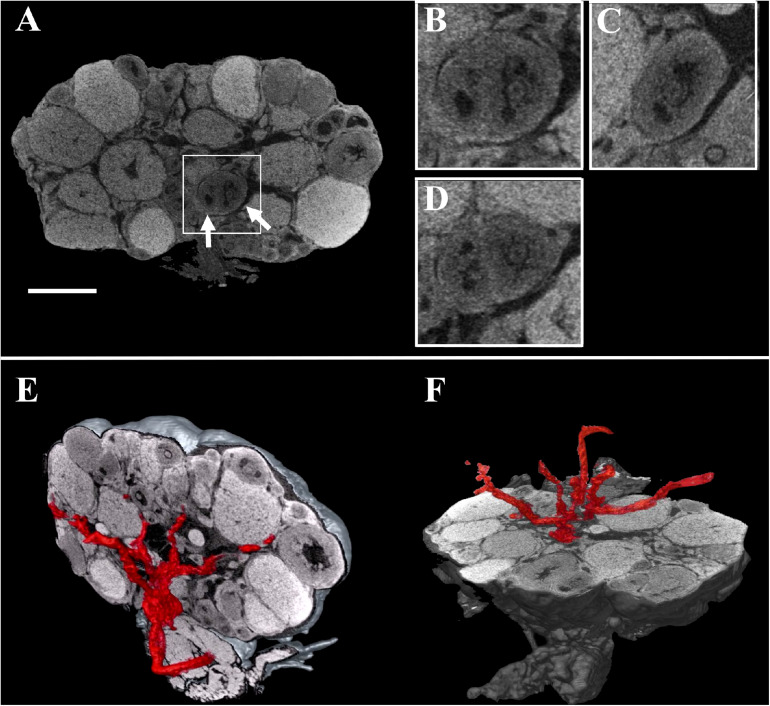
FIGURE 2.
Combined three-dimensional rendering of microCT sections of the ovary and of the main vasculature. (A) A representative equatorial microCT slice. Inset, two T7 follicles (arrows). (B–D) coronal, sagittal, and axial planes of the two T7 follicles shown in the inset. (E,F) Reconstruction of the main vasculature on the coronal and axial section, respectively. Bar, 500 μm.

