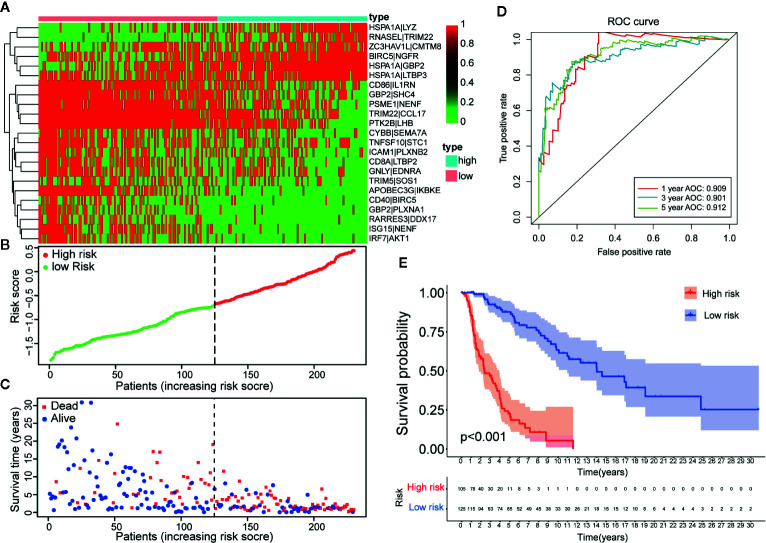
Figure 3.
Establishment and assessment of a 23-IRGP signature. (A) A heat map of the risk scores of the 23 IRGPs. (B) According to the 23 IRGPs, the training cohort was divided into high and low immune risk groups. The red and green points represent the risk scores of the high and low risk groups, respectively. (C) A plot of OS based on the 23 IRGPs. The red points represent deaths, while the blue points represent survivors. (D) The AUCs for 1-, 3-, and 5-year OS in the training cohort were 0.909, 0.901, and 0.912, respectively. (E) According to the OS curve, OS was poorer for the high risk group as compared to the low risk group in the training cohort (p < 0.001).

