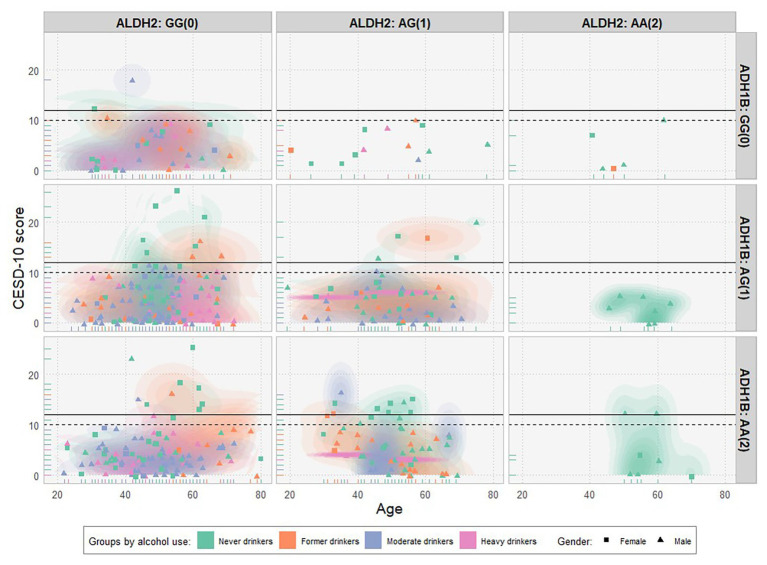
Figure 1.
Scatter plot of CESD-10 scores over age by gender, genotypes, and groups of alcohol use (N = 476). CESD-10 scores over age were plotted by different combinations of ALDH2 rs671 (horizontal) and ADH1B rs1229984 (vertical) genotypes (with the number of effect alleles in parenthesis). Each dot represents a single subject. The solid and dashed black horizontal lines denote for cut-off scores of 12 (optimal) and 10 for the depression, respectively. Different genders (female/male) and groups of alcohol use (never drinkers/former drinkers/moderate drinkers/heavy drinkers) were represented by distinct shapes and colors, respectively.

