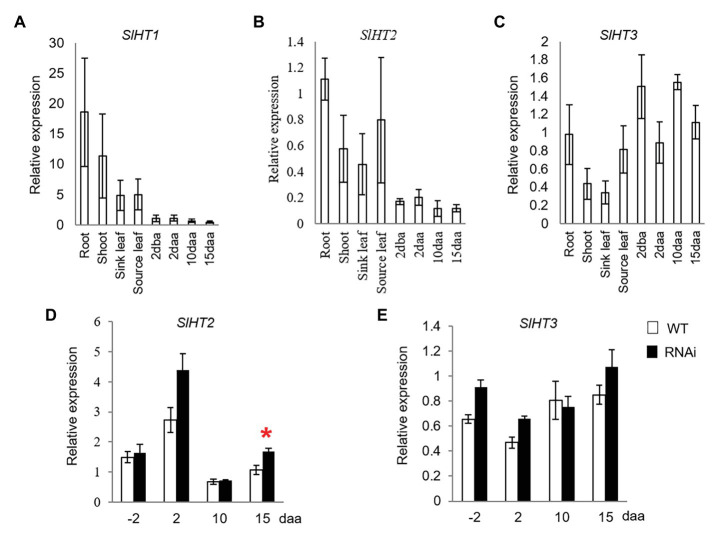
Figure 3.
Quantitative real-time-PCR analysis of the expression profiles of hexose transporter (HT) genes. (A–C) are expression profiles of HTs in different tissues of tomato plants. (A) SlHT1. (B) SlHT2. (C) SlHT3; (D) and (E) are expression profiles of HTs in response to elevated CWIN activity in SlINVINH1-RNAi as compared to wild type (WT) plants. (D) SlHT2. (E) SlHT3. Tissues examined were vegetative and reproductive tissues. Vegetative tissues included root and shoots from 2-week old seedlings, sink, and source leaves from similar raised plants. Reproductive tissues included 2 dba ovaries and 2, 10, and 15 daa fruits. SlCAC and SlSAND were used as reference genes. Each value is the mean ± SE of three biological replicates. Student t-test was applied in comparing SlINVINH1-RNAi and WT plants in each individual stage. *Indicates significance at p < 0.05.

