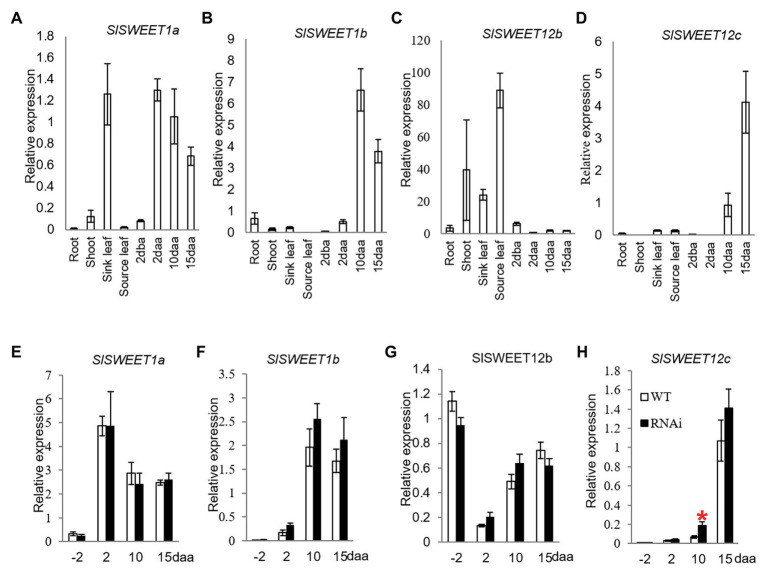
Figure 4.
Quantitative real-time-PCR analysis of the expression profiles of sugars will eventually be exported transporter (SWEET) genes. (A–D) are expression profiles of SWEETs in different tissues of tomato plants. (A) SlSWEET1a. (B) SlSWEET1b. (C) SlSWEET12b. (D) SlSWEET12c. (D–G) are expression profiles of SWEETs in response to elevated CWIN activity in SlINVINH1-RNAi as compared to WT plants. (E) SlSWEET1a. (F) SlSWEET1b. (G) SlSWEET12b. (H) SlSWEET12c. Tissues examined were vegetative and reproductive tissues. Tissues included 2 dba ovaries and 2, 10, and 15 daa fruits. SlCAC and SlSAND were used as reference genes. Each value is the mean ± SE of three biological replicates. Student t-test was applied in comparing SlINVINH1-RNAi and WT plants in each individual stage. *Indicates significance at p < 0.05.

