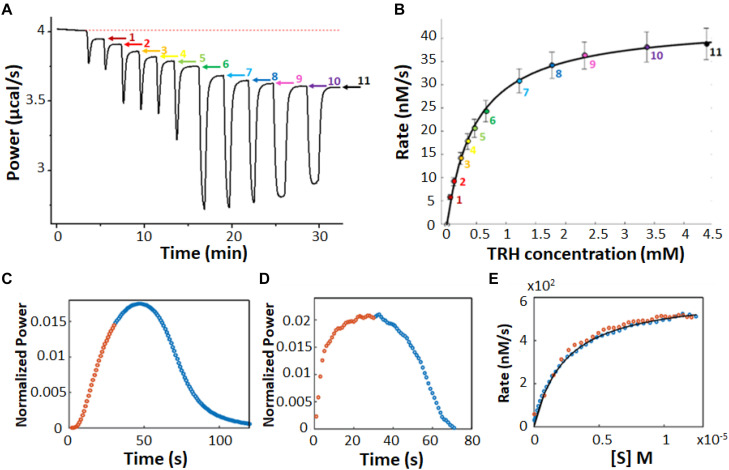
FIGURE 3.
Multiple injection and single injection ITC enzyme kinetic data. (A) Multiple injection assay of prolyl oligopeptidase in the sample cell and one of its substrates, thyrotropin releasing hormone, in the syringe (Di Trani et al., 2017). The downward spikes correspond to dilution artifacts from each injection (3, 3, 6, 6, 6, 10, 30, 30, 30, 60, and 60 μL). Larger injections produce larger spikes. The displacement, following each injection, of the horizontal baseline relative to the initial baseline (red dotted line) is proportional to the enzyme velocity. (B) MM/BH plot calculated from the data in (A). Error bars correspond to the standard deviations of three repeat experiments. (C) Single injection assay with trypsin in the sample cell and one of its substrates, benzoyl-L-arginine ethyl ester, in the syringe (Di Trani et al., 2018b). Data collected during (after) the 30 s injection are plotted in orange (blue). (D) Deconvolution of the data in (C) to remove the effect of the delayed instrument response according to Equation 10 and an empirical response function. Note that during the first 30 s, the substrate is injected into the sample cell faster than it is consumed and its concentration gradually increases, while the reaction velocity asymptotically approaches the maximum Vmax value, in accordance with the MM/BH Equation (orange circles). After the injection ends, the substrate continues to be consumed and its concentration gradually drops, while the reaction velocity decreases to zero once more (blue circles). (E) MM/BH plot generated from the data in (D) using Equation 8. The rate versus [S] values are superimposable for the injection (orange, increasing [S]) and post-injection (blue, decreasing [S]) halves of the experiment, providing cross-validation for the data.

