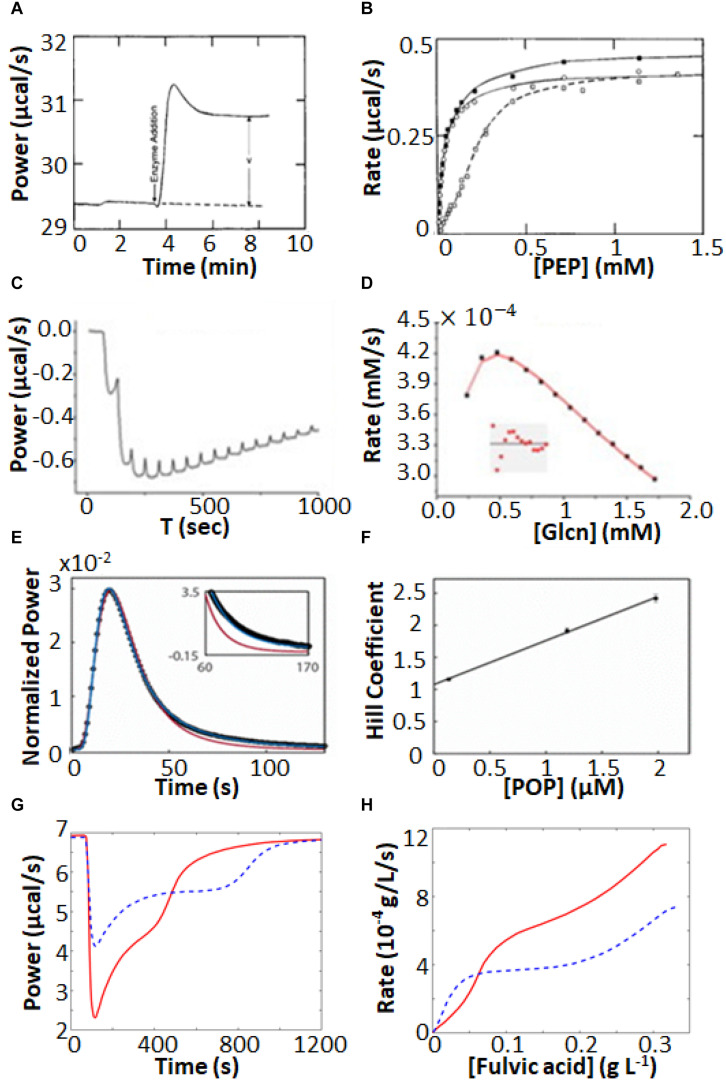
FIGURE 4.
Non-MM/BH enzyme kinetics observed by ITC. (A) Single injection experiments with pyruvate kinase in the syringe and phosphoenolpyruvate and ADP in the sample cell (Lonhienne and Winzor, 2002). The displacement of the horizontal baseline is proportional to the velocity of the enzyme. (B) Baseline displacements (ΔP) obtained at different [PEP] (O), in the presence of phenylalanine as an allosteric effector (□), and in the presence of phenylalanine and proline as a molecular crowding agent (■). (C) Multiple injection assay with gluconokinase and ATP in the sample cell and gluconate in the syringe (Rohatgi et al., 2015). (D) Enzyme velocities from (C), fitted to a variant of Equation 12 that accounts for formation of the non-productive E⋅ADP⋅gluconate ternary complex. (E) Single injection assay with substrate (thyrotropin releasing hormone) in the syringe and prolyl oligopeptidase (POP) in the sample cell (Di Trani et al., 2017). Points are experimental data, red and blue curves are the best fits with classical MM/BH model, and cooperative model (Equation 11) with n = 2.4, respectively. (F) Dependence of the extracted Hill coefficient on POP concentration (0.125, 1.2, and 2 μM). (G) Single injection assay with versatile peroxidase in the sample cell and fulvic acid in the syringe, exhibiting biphasic cooperative kinetics (Siddiqui et al., 2014). (H) Reaction rates as s function of substrate concentration calculated from (G). In (G,H), data were extracted from the original reference using Graph Grabber v2.0.2 (Quintessa) and plotted using MATLAB (MathWorks); red solid curves indicate the first injection and blue dashed curves indicate the second injection.

