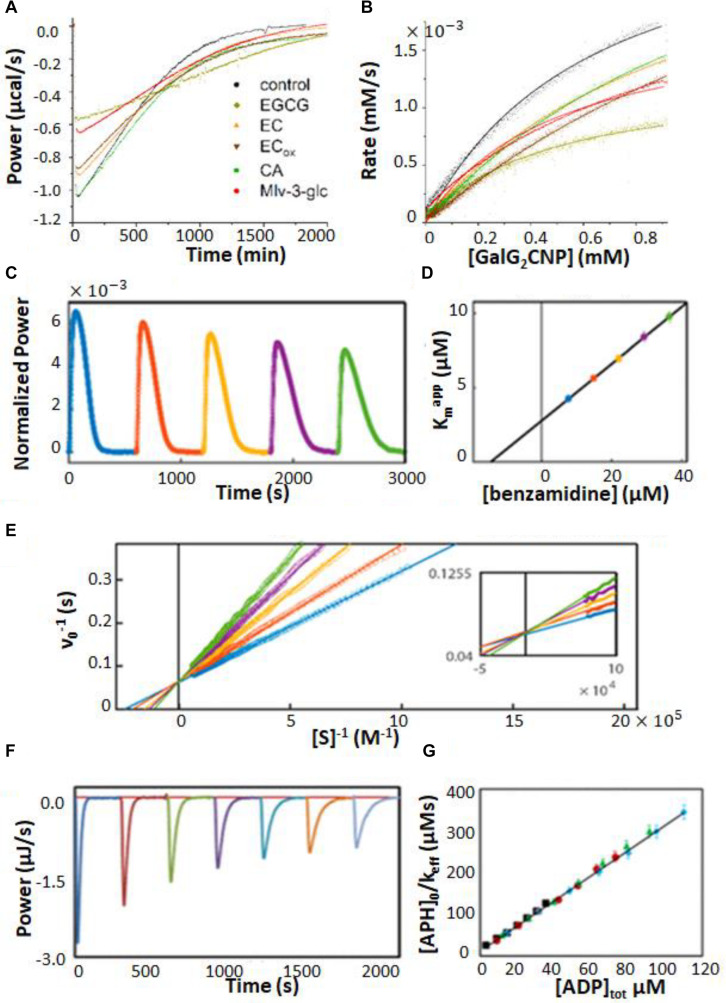
FIGURE 5.
Enzyme inhibition characterized by ITC single injection-type assays. (A) Inverse injection assay with α-amylase in the syringe and the substrate 2-chloro-4-nitrophenyl-maltoside (GalG2CNP) in the syringe together with a variety of inhibitors: ACA (acarbose), CA (chlorogenic acid), EC (epicatechin), ECox (oxidized epicatechin), EGCG (epigallocatechin gallate), Mlv-3-glc (malvidin-3-glucoside) (Hanhineva et al., 2010). (B) MM/BH curves calculated from the curves in (A). (C) Single injection assay with substrate (benzoyl-L-arginine ethyl ester) and inhibitor (benzamidine) in the syringe and trypsin in the sample cell (Di Trani et al., 2018b). (D) Kmapp values extracted from direct fits to each of the injections (different colors) in (C). (E) Data from (C), deconvoluted using the empirical response model (Equation 10), converted to ν0 and [S] and presented as a double-reciprocal plot. (F) Single injection assay with substrate (ATP) in the syringe and aminoglycoside-3′-phosphotransferase IIIa (APH) and kanamycin A in the sample cell (Wang et al., 2019). Under these dilute conditions [ATP] << Km, ITC peaks decay exponentially with rate constant keff = kcat/Km. keff decreases with each injection due to product inhibition by ADP. (G) Plot of [APH]/keff as a function of total accumulated ADP concentration.

