Fig. 1.
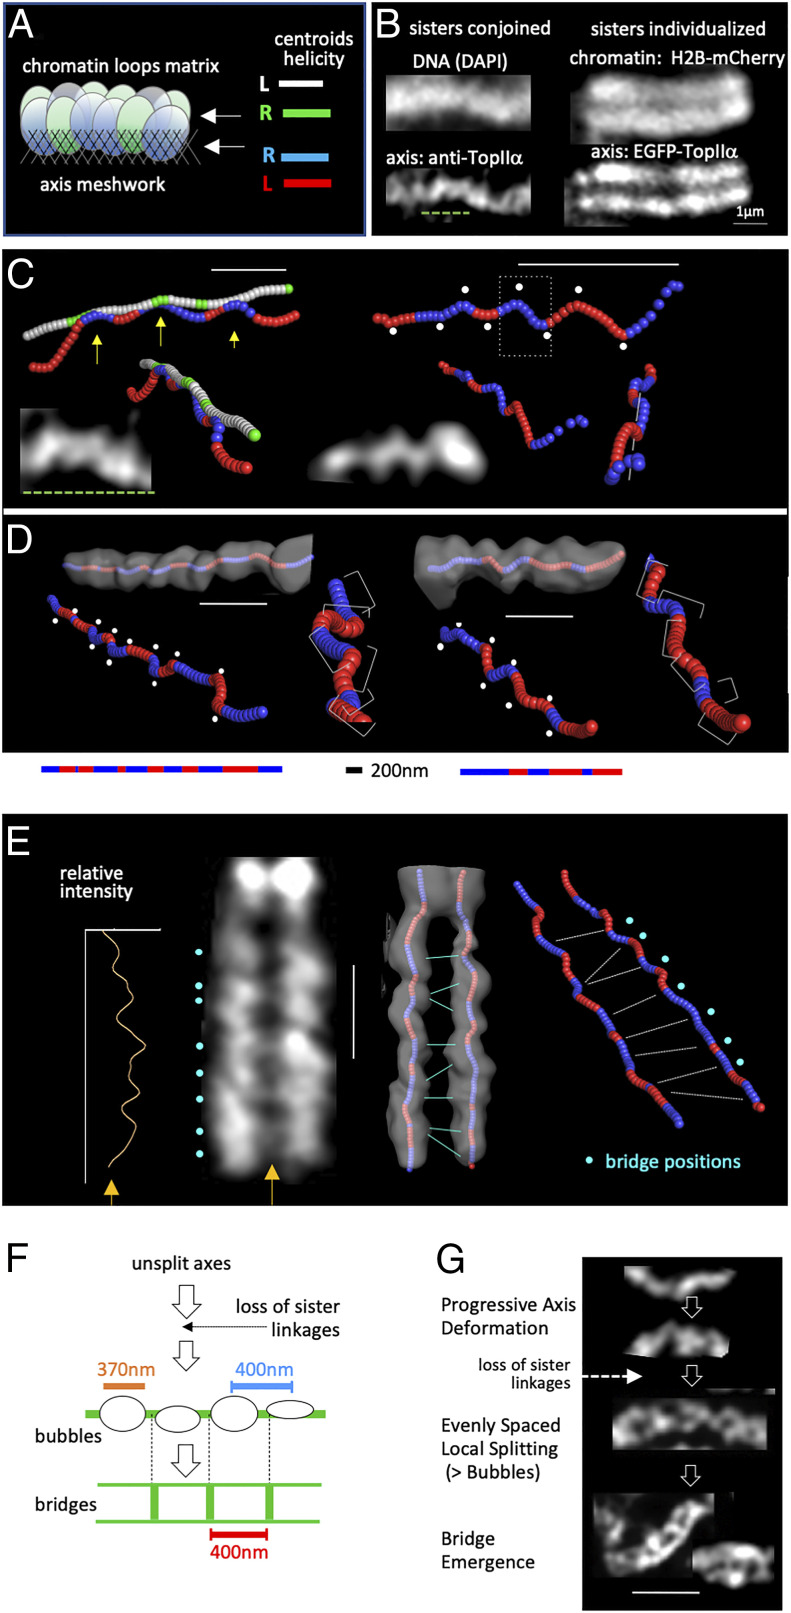
Two spatial patterns emerge in succession along mitotic chromosomes by a proposed single continuous stress-promoted process. (A) Each mitotic chromatid is organized as a linear array of loops that emanate from a complex axis meshwork. At prophase, prior to sister individualization, the two arrays are closely conjoined into a single morphological unit. Arrows indicate that the paths of the centroids of the chromatin and axis signals (defined as in B) were determined. In each case, the shape was sliced along its length and the centroid of each slice determined and assembled into the corresponding path. The tendency for helicity along the path and the handedness of that helicity were then determined (details in ref. 2). (B) Images of DNA (DAPI) or chromatin (H2B-mCherry) and TopIIα axis signals for a prophase chromosome comprising a closely conjoined pair of sister chromatids (Left) and postprophase chromosome in which sisters are individualized (Right) (details in Materials and Methods). (C and D) Examples of undulating axis paths along unsplit prophase chromosomes (C) and individual chromatids of split postprophase chromosomes (D). (C) Centroid paths of the conjoined axes (red/blue) of two prophase chromosome segments; the centroid path of the chromatin shape (green/white) is also shown for the segment at Left. (D) Centroid paths of the axes of single chromatids (one of two sister chromatids) from two different postprophase chromosomes. (Top) Centroids are superimposed on thresholded Pymol images of the axis shapes. (Bottom) Different views of the axis paths illustrating regular changes in helical handedness (red/blue); regular kinks that often occur at positions of handedness changes (white dots) and the tendency for successive segments to be rotated (twisted) relative to one another (brackets) are shown. (E) Chromosomes with individualized sisters exhibit separated parallel axes with undulating paths that are linked by “miniaxis” bridges. Bridges (turquoise dots) are visible by the eye in the primary image (Left) and also definable as peaks of intensity along a line between the sister chromatids (yellow arrows). Positions with respect to axis paths (Right) are defined by superimposition of paths on thresholded Pymol images of axis shapes (Middle). (F) Sister chromatid axis separation occurs via evenly spaced bubbles with evenly spaced interaxis bridges emerging from the short unsplit regions between bubbles (examples in G). (G) The sequence of prophase events that give rise to spatially patterned (regular) axis deformations and then spatially patterned (evenly spaced) bridges is proposed to involve a single continuous process promoted by mechanical stress within the axes. (Scale bar: 1 µm.) B, Right and C–G adapted from ref. 2, with permission from Elsevier.

