
FIGURE 8.
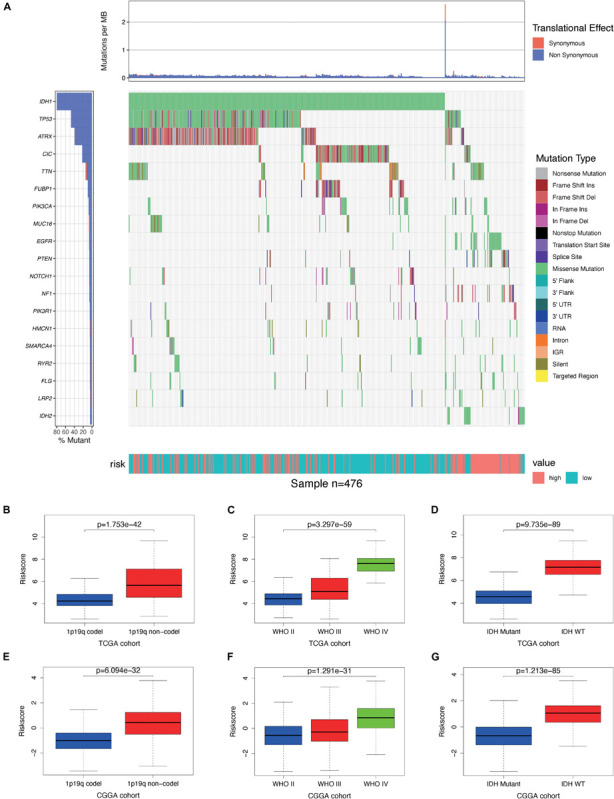
Association between genomic alterations, pathologic characteristics, and the autophagy-related signature. (A) Differential somatic mutation analysis between high-risk group and low-risk group in The Cancer Genome Atlas (TCGA) cohort. (B–D) Distribution of the risk score in glioma patients stratified by 1p/19q codeletion status, WHO grade, and isocitrate dehydrogenase (IDH) mutation status in TCGA cohort. (E–G) Distribution of the risk score in glioma patients stratified by 1p/19q codeletion status, WHO grade, and IDH mutation status in the Chinese Glioma Genome Atlas (CGGA) cohort.