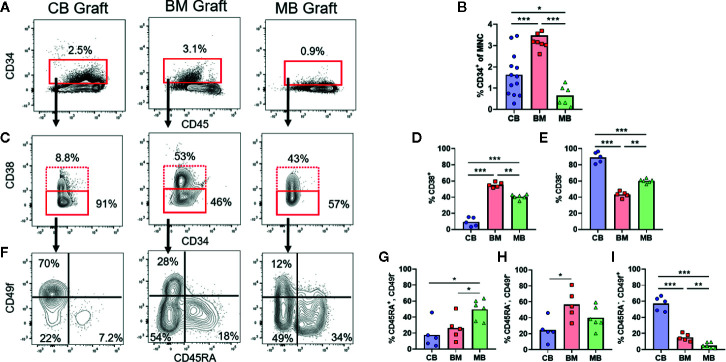
Figure 1.
Composition of human HSPC populations varies among graft sources. Flow cytometric analysis of HSPC populations in primary graft tissues. (A) Representative plots of panHLA-class-I+ human cells from umbilical cord blood (CB), bone marrow (BM), and G-CSF mobilized peripheral blood (MB), showing the percentage of CD34+ cells (red box) in each graft. (B) Aggregated results showing percentage of CD34+ cells detected in individual graft samples. Symbols show results from individual samples of CB (blue), BM (red), or MB (green) tissue, with bars representing the arithmetic means. (C) Representative plots showing flow cytometric staining of CD34+ cells for CD38. (D, E) Aggregated results showing the percentage of cells in the CD38+ (D) or CD38− (E) gates. (F) Representative plots showing flow cytometric staining of CD34+CD38− cells for CD45RA and CD49f. (G–I) Aggregated results showing the percentage of CD34+CD38− cells corresponding to uncommitted progenitors (CD45RA+CD49f−, G), multipotent progenitors (CD45RA−CD49f−, H), and long-term HSCs (CD45RA−CD49f+, I). *p < 0.05; **p < 0.01; ***p < 0.001.

