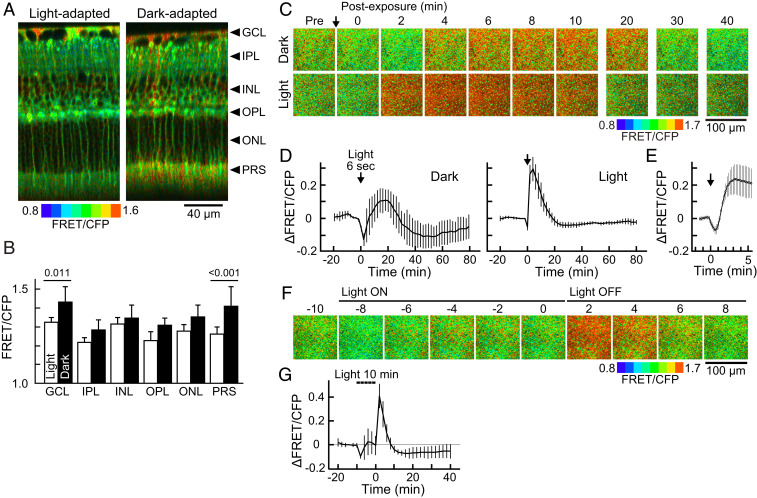
Fig. 2.
Basal PKA activities and light-induced PKA activity changes in the dark- and light-adapted PKAchu retinas. (A) Longitudinal PKA activity images. Arrowheads indicate the positions of each layer analyzed in B. (B) FRET/CFP values obtained from each layer of the retina. Mean ± SD, n = 7 and 18 measurements for light- and dark-adapted retinas, respectively. The numbers on the bars are P values from Tukey–Kramer’s test following a two-way ANOVA. (C) Time-lapse PKA activity images from dark- and light-adapted retinas. Images are cross-sectional views obtained at the PRS layer. An arrow indicates the timing of a 6 s light stimulation (500 nm and 1.0 × 10⁷ photons µm−2 s−1). (D) Time courses of the PKA activity at the PRS layer in dark- and light-adapted retinas. Mean ± SD (n = 3 and 8 measurements, respectively). (E) The early phase of the light response in light-adapted retinas. Mean ± SD (n = 5). (F) Time-lapse PKA activity images at the PRS layer in the light-adapted retina. Bars indicate the timing of a 10 min light stimulation (500 nm and 3.2 × 10⁷ photons µm−2 s−1). (G) Time course of the PKA activity at the PRS layer. A dashed bar indicates the timing of light stimulation. Light was temporarily turned off four times for image acquisitions (every 2 min for <10 s each). Mean ± SD (n = 4). Data points in D, E and F were obtained every 2 min, 12 s, and 2 min, respectively.

