Fig. 3.
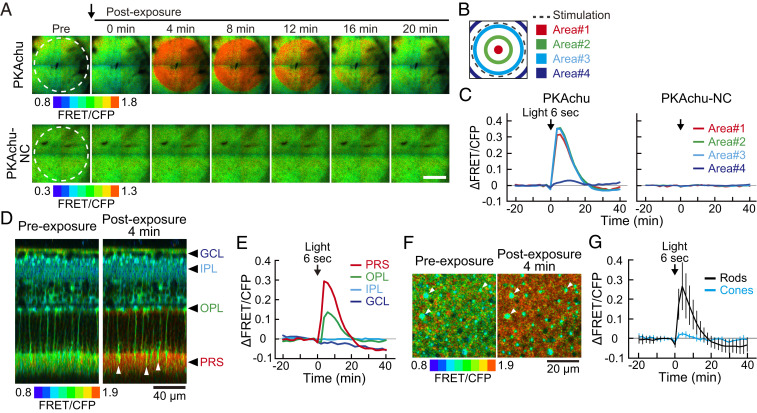
Spatial distribution of the light-off-induced PKA activation. (A) Time-lapse PKA activity images from light-adapted PKAchu and PKAchu-NC retinal explants. Images are cross-sectional views at the PRS layer. Light stimulation (dashed circle, wavelength 500 nm, 1.0 × 10⁸ photons µm−2 s−1, and 6 s) was given just before 0 min (arrow). (Scale bar, 400 µm.) (B) Positions of four areas analyzed in C. (C) Time courses of the ΔFRET/CFP in the 6 s stimulation experiments. Values are the means of five (PKAchu) and three (PKAchu-NC) measurements. (D) Longitudinal view of the light-induced PKA activation toward 6 s stimulation (500 nm and 1.0 × 10⁸ photons µm−2 s−1). Images were reconstructed from a z stack of 61 images with 3 µm z intervals. White arrowheads show cones. Black arrowheads indicate the layer positions analyzed in E. (E) Time courses of the light-induced PKA activity change at the four indicated layers. Values are the mean of four measurements. (F) High-magnification cross-sectional view of the light-off-induced PKA activation at the PRS layer. Images were obtained before and after the 6 s stimulation (500 nm and 1.0 × 10⁸ photons µm−2 s−1). White arrowheads indicate cones. (G) Time courses of the light-induced PKA activity change in rods (black) and cones (cyan) in the 6 s stimulation experiments. Rod and cone signals were separated by intensity-based image segmentation. Values are the mean ± SD (n = 8 measurements). Data points in C, E, and G were obtained every 2 min. An arrow in each panel indicates the timing of light stimulation.

