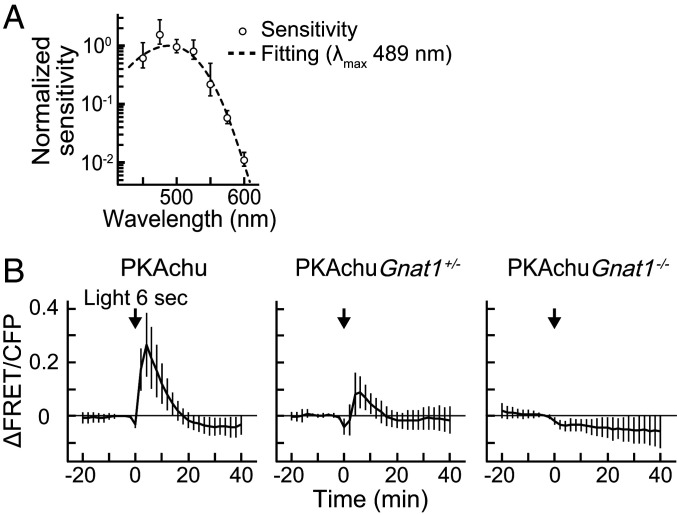
Fig. 4.
Involvement of rhodopsin and transducin in the light-off-induced PKA activation. (A) Spectral sensitivity plot of the light-induced rod PKA activation. Plots were fitted with the spectral template of the visual pigment to obtain the estimated λmax of 489 nm (dashed curve). Data were normalized to the peak of the curve. Values are the mean ± SEM (n = 3–7). (B) Time courses of the PKA activity in the 6 s stimulation experiments, obtained from rods imaged at PRS in wild-type PKAchu, PKAchu Gnat1+/−, and PKAchu Gnat1−/−. Data for wild-type PKAchu is a replot of Fig. 3G. An arrow in each panel indicates the timing of 6 s light stimulation (500 nm and 1 × 10⁸ photons µm−2). Values are the mean ± SD (n = 9 for PKAchu Gnat1+/− and n = 18 for PKAchu Gnat1−/−).

