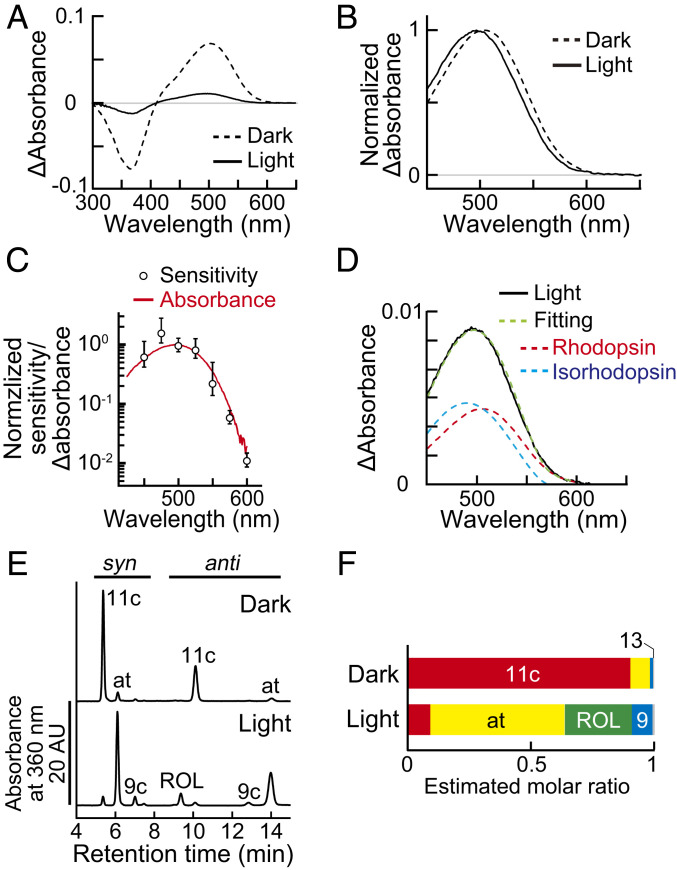
Fig. 5.
Formation of isorhodopsin in the light-adapted retinal explant. (A) Difference absorption spectra of retinal photopigments measured at 4 °C. Solid curve: light-adapted retinal explants and dashed curve: dark-adapted control. Values are the average of three measurements. Each sample was prepared from one retina. (B) Normalized spectra created from the data in A. (C) A comparison between the difference absorption spectrum of the light-adapted retina (red) and the spectral sensitivity data (open circles, replot of Fig. 4A). Note that the vertical axis is in logarithmic scale. (D) Data fitting with rhodopsin (red) and isorhodopsin templates (cyan). The averaged spectrum of the light-adapted retina (solid black curve, replot from [A]) was fitted with the sum of the rhodopsin and isorhodopsin spectra (green). (E) HPLC chromatogram of retinoids extracted from a dark- or light-adapted retina. Retinal isomers were extracted as syn- and anti-oxime forms, separated by the normal phase HPLC, and detected by their absorbance at 360 nm. (F) Molar ratio of the retinoids estimated by HPLC. Values are the means of two and three measurements for dark- and light-adapted retinas, respectively. The 11c: 11-cis retinal; at: all-trans retinal; 9c: 9-cis retinal; 13: 13-cis retinal; ROL: all-trans retinol.

