Fig. 6.
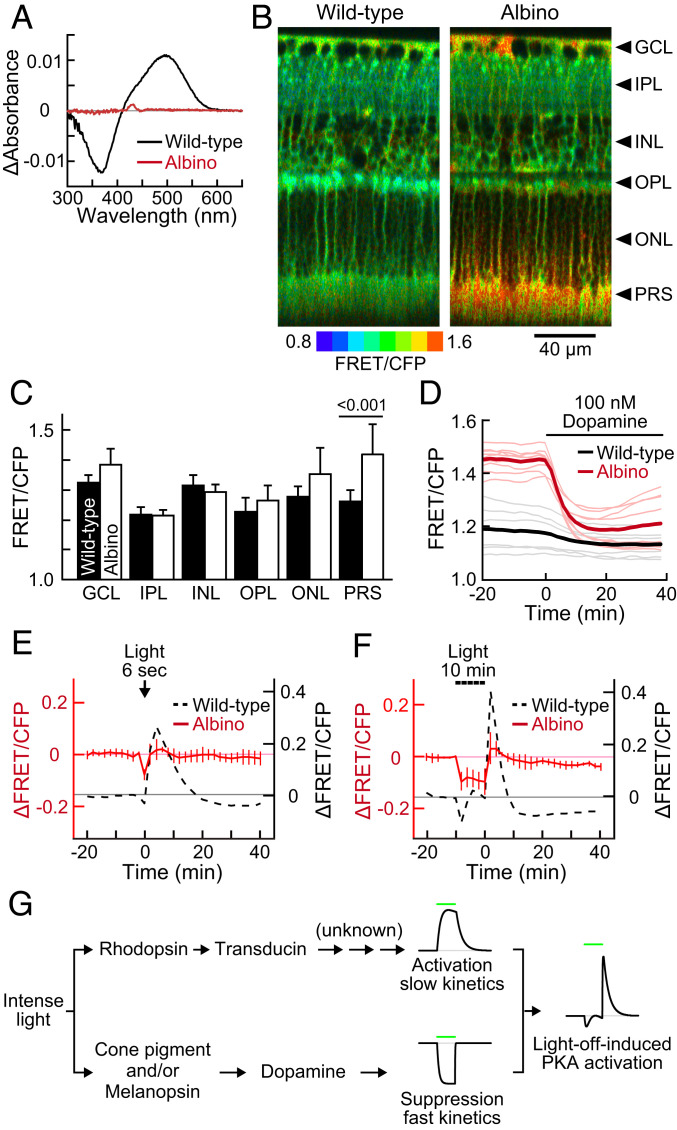
Basal PKA activity and light-induced PKA suppression in the albino PKAchu retina. (A) Difference absorption spectra of membrane proteins extracted from a wild-type (black) or an albino (red) mouse retina. Values are the means of three samples. (B) Longitudinal PKA activity images of wild-type and albino PKAchu retinas. Arrowheads indicate the positions of each layer analyzed in C. (C) FRET/CFP values obtained from each layer of the retina. Mean ± SD, n = 7 and 14 measurements for the wild-type and albino retinas, respectively. The number on the bar is a P value from Tukey–Kramer’s test following a two-way ANOVA. (D) Responses of rod PKA to 100 nM dopamine perfusion in wild-type (black) and albino (red) PKAchu retinas. Light-colored thin curves and dark-colored bold curves are individual and averaged data, respectively. (E and F) Light-induced PKA activity changes in response to 6 s stimulation (E; 500 nm and 1.0 × 10⁸ photons µm−2 s−1) and 10 min stimulation (F; 500 nm and 3.2 × 10⁷ photons µm−2 s−1). Albino data (red, mean ± SD, n = 4 and 5, respectively) are adjusted 0.16 upward from the wild-type data (dashed black) with consideration for the average difference in the basal FRET/CFP (PRS in C). Wild-type data are replots of Figs. 3G and 2G, respectively. Data points were obtained every 2 min. (G) A hypothetical model of the light-off-induced PKA activation. Green bars show the timing of a light stimulation.

