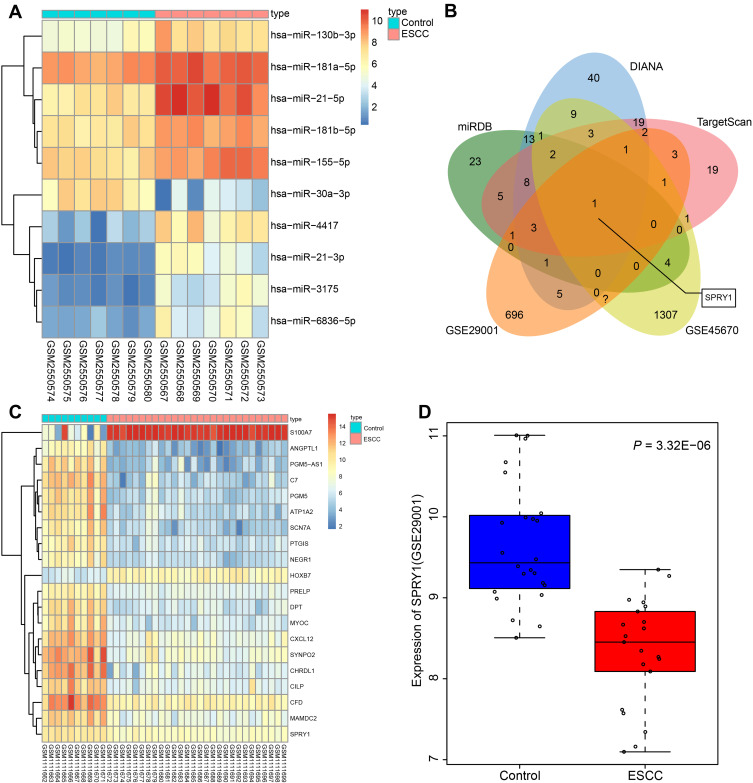
Figure 1.
Microarray-based gene expression profiling of DEGs and differentially expressed miRs in ESCC. (A) The heat map of the top 10 differentially expressed miRs obtained from the ESCC-related gene expression dataset GSE97049. The x-axis represents the sample number, while the y-axis represents the differential miRNA. The right upper histogram represents the color gradation. Each rectangle in the figure corresponds to the expression of one sample. (B) The intersected genes of the targeted genes obtained from the miRDB, DIANA, and TargetScan databases, and DEGs from datasets GSE45670 and GSE29001. (C) The heatmap of top 20 DEGs predicted in the gene expression dataset GSE45670. The x-axis represents the sample number, while the y-axis indicates the DEGs. The histogram in the upper right represents the color gradation. Each rectangle in the figure corresponds to the expression of one sample. (D) The expression pattern of SPRY1 predicted in the gene expression dataset GSE29001.

