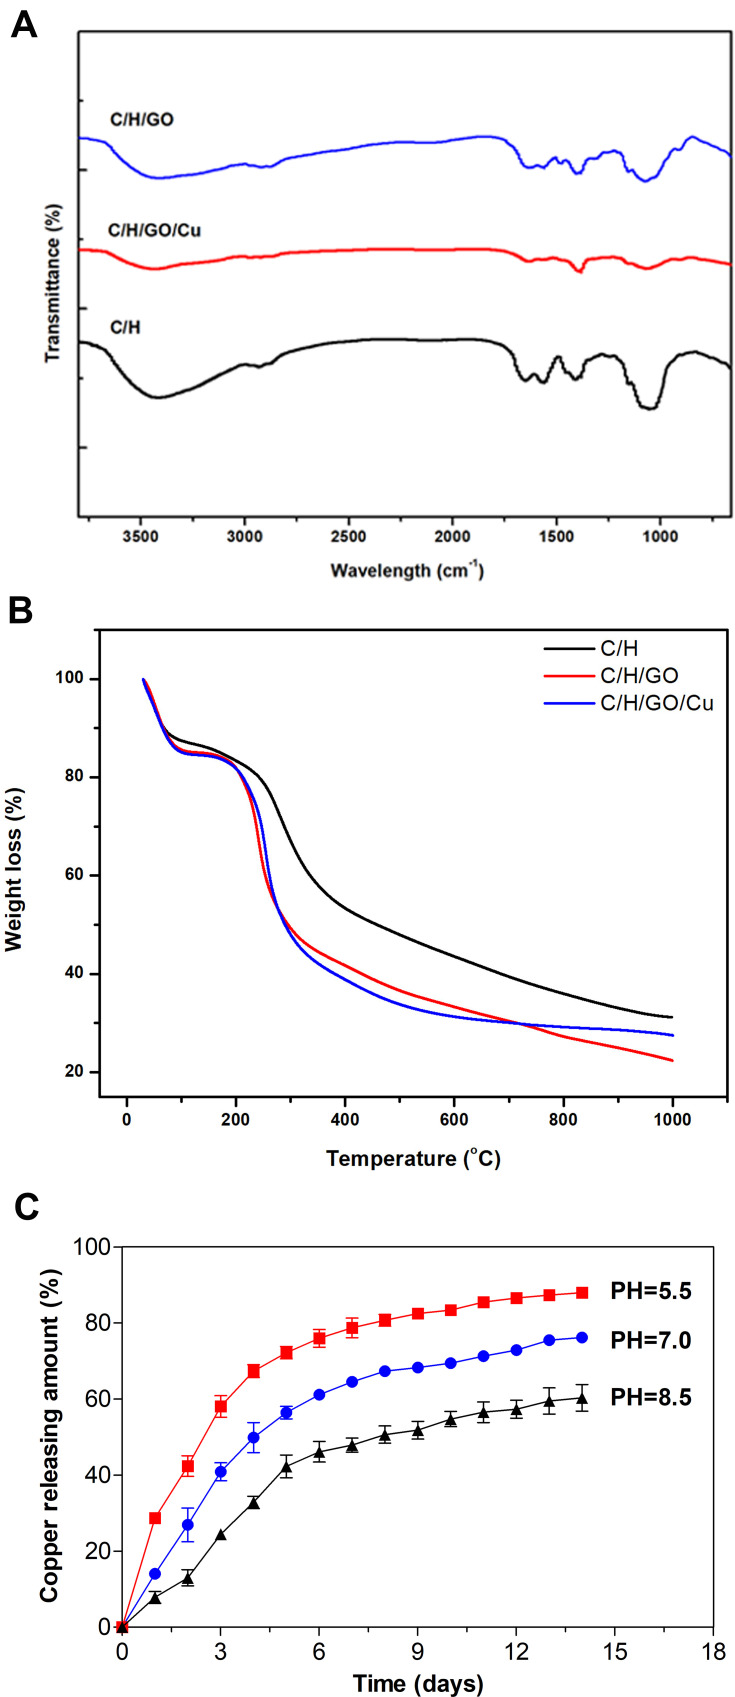
Figure 2.
Surface and in vitro degradation features of the dressings.
Notes: (A) FT-IR spectra of the dressings ranging from 4000 to 400 cm−1 at a resolution of 4.0 cm−1. (B) TGA curves of the dressings ranging from 10 to 1000 °C at 10 °C/min heating rate under nitrogen protection (80 mL/min). (C) Cumulative release profiles of copper (CuNPs and Cu2+) from the C/H/GO/Cu dressings under different pH values (5.5, 7.0 and 8.5) over 14 days.
Abbreviations: C/H/GO/Cu, GO/Cu-decorated chitosan/hyaluronic acid dressing; CuNPs, copper nanoparticles; FT-IR, Fourier transform infrared; TGA, thermogravimetric analysis.

