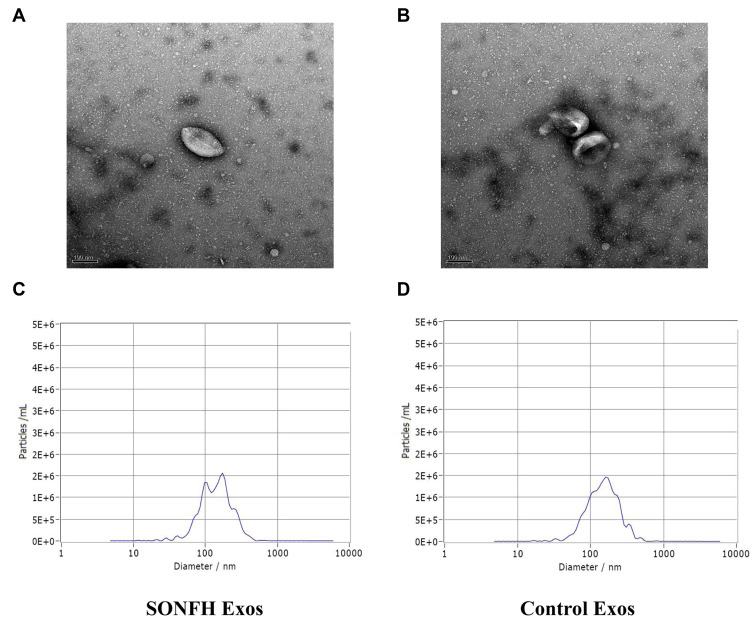
Figure 1.
Characterization of plasma exosomes. (A and B) Transmission electron microscopy (TEM) image showed the morphology of plasma exosomes in steroid-induced osteonecrosis of the femoral head (SONFH) patients and healthy control subjects. (C and D) The nanoparticle tracking analysis (NTA) was used to estimate particle size distribution of plasma exosomes in SONFH patients and healthy control subjects.

