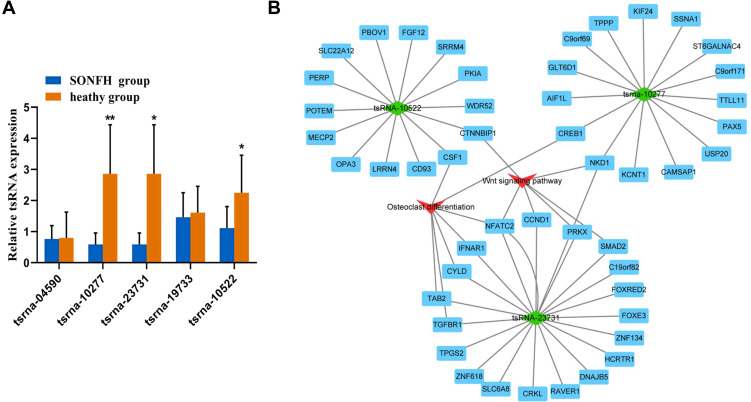
Figure 4.
Validation of tsRNA expression and construction of DE tsRNAs/mRNA pathway interaction network using Cytoscape software. (A) Relative expression levels of the 5 candidate tsRNAs were validated by real time-qPCR. The values were expressed as mean ± SD (n=3). *p<0.05 and **p<0.01 are shown for SONFH group vs healthy heathy group. (B) Integrated tsRNAs/mRNA pathway analysis. The red triangle refers to Wnt signal pathway and osteogenic differentiation, and the green rhombus represents DE tsRNAs. Blue rectangles represent mRNAs.

