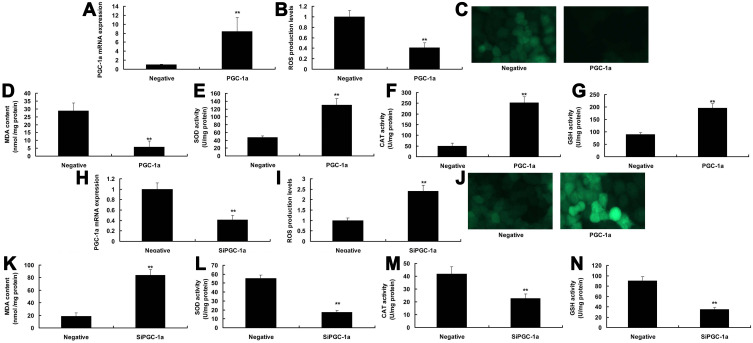
Figure 3.
PGC-1α inhibited ROS-induced oxidative stress in vitro model. PGC-1α mRNA expression (A), ROS production levels (B and C), MDA SOD, CAT and GSH activity levels (D–G) by over-expression of PGC-1α; PGC-1α mRNA expression (H), ROS production levels (I and J), MDA SOD, CAT and GSH activity levels (K–N) by down-regulation of PGC-1α. Negative, negative group; PGC-1α, over-expression of PGC-1α group; si-PGC-1α, down-regulation of PGC-1α group. **p<0.01 versus DMMI mice group.

