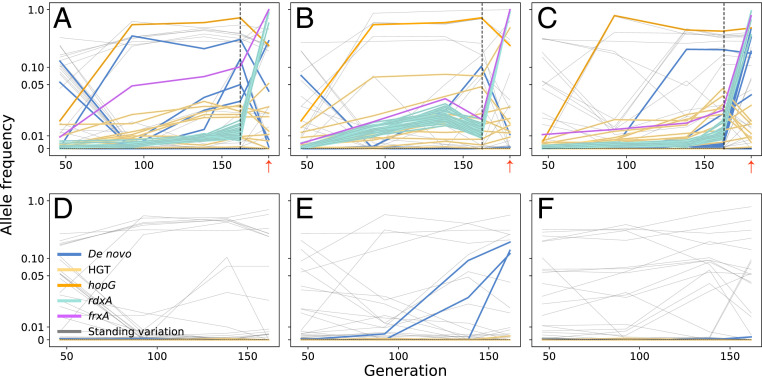
Fig. 2.
Trajectories of allele frequencies during evolution, determined by whole-population sequencing. Each line depicts an individual allele segregating in three HGT (A–C) and three non-HGT control (D–F) populations plotted on a symlog scale (linear for values below 0.05). The dashed vertical lines after 161 generations show the frequencies of all alleles at the end of the no-antibiotic evolution experiment, before exposure to metronidazole (8 μg/mL). The frequencies at the end of the plot show allele frequencies after the exposure to metronidazole (small red arrows). The HGT alleles are shown in light orange except for the rdxA (turquoise), frxA (magenta), and hopG (bright orange) HGT alleles. Inactivation of the rdxA (turquoise) and frxA (magenta) genes is required for metronidazole resistance. Light gray lines show standing genetic variants, already present in the recipient population at the beginning of the experiment. The identity and frequency of HGT and de novo mutations are provided in SI Appendix, Table S1, and all mutations, including standing genetic variants, are described in SI Appendix.

