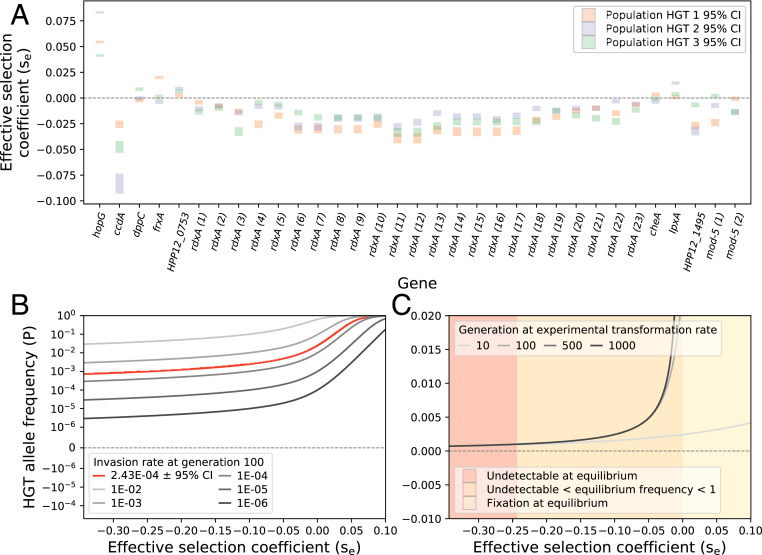
Fig. 4.
Maintenance of genetic variation with HGT and fitness estimates from sequence data. A shows the estimates of the effective selection coefficient for donor-derived alleles, which were estimated, using the model, from allele frequency trajectories. Calculations were carried out for each of the three independently evolving populations, HGT rep 1 (orange bars), HGT rep 2 (purple bars), and HGT rep 3 (green bars) (SI Appendix, Fig. S3). The length of the bars indicates the 95% CI, calculated based on variation in HGT invasion rate (the model parameter γ), estimated from DNA sequence data (Materials and Methods). B shows the expected frequency of horizontally acquired alleles after 100 generations of evolution for several values of γ. The red curve corresponds to the HGT invasion rate (γ) estimated from our experiments, which give rise, for example, to ∼1% frequencies of deleterious alleles with se ∼ −0.025 after 100 generations. C shows the expected frequencies of horizontally acquired alleles after 10, 100, 500, and 1,000 generations, given the HGT invasion rate (γ) estimated from the evolution experiment. The shaded areas correspond to three equilibrium frequency states for donor alleles (undetectably rare, detectable and polymorphic, and fixed).

